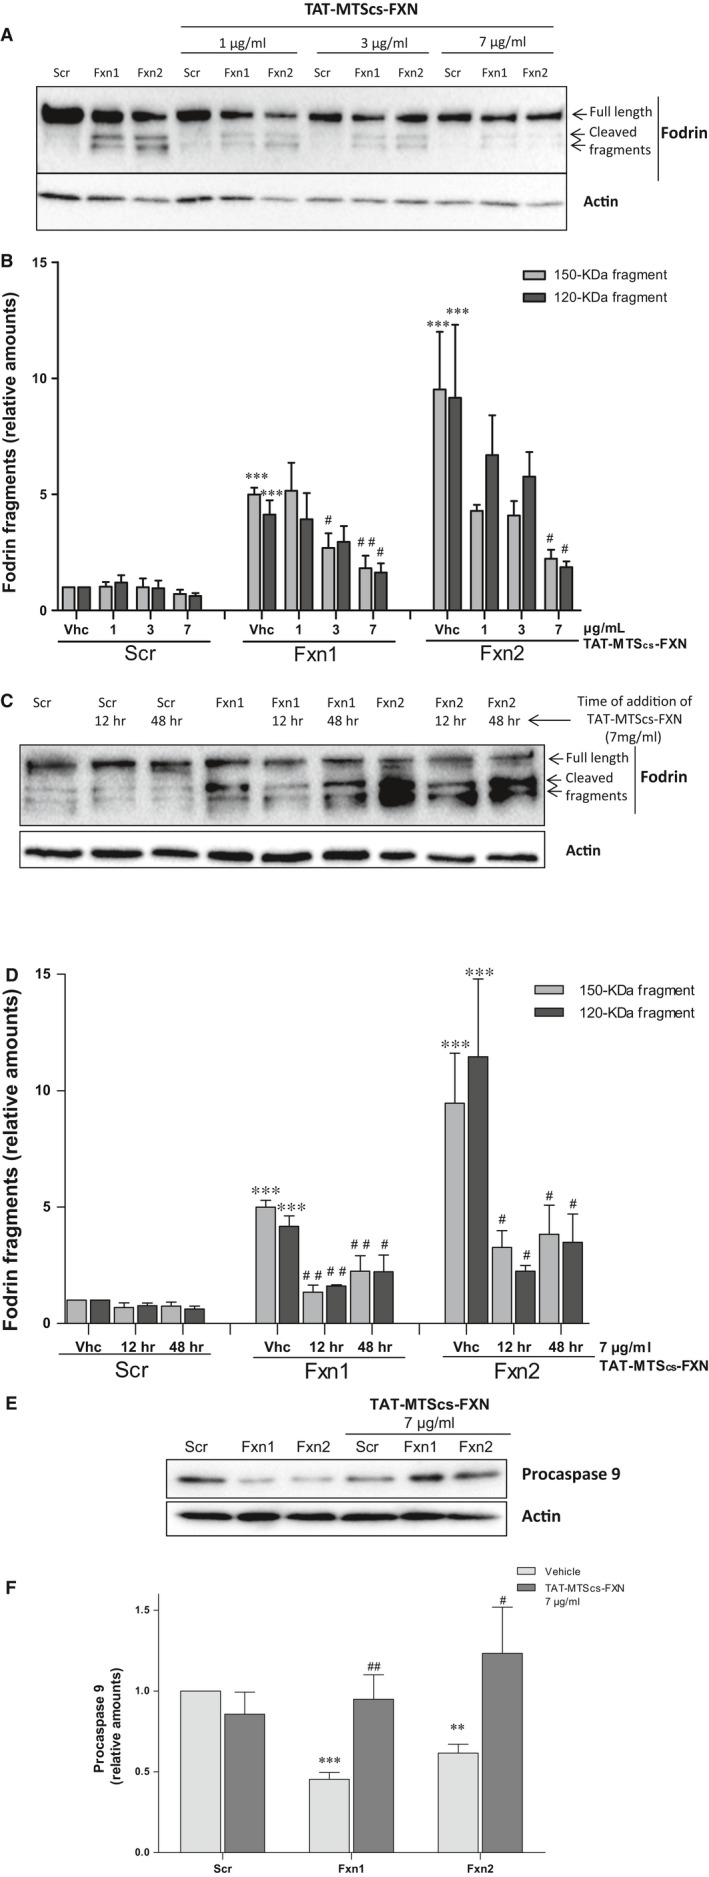
Figure 4.

Fodrin cleavage is reduced by TAT‐MTScs‐FXN treatment (A) Western blotting of α‐Fodrin fragmentation. Crude extracts from Scr, Fxn1 and Fxn2 cells treated with increasing doses of 1, 3 and 7 μg/ml TAT‐MTScs‐FXN or vehicle solution 48 hrs after lentiviral transduction were checked for α‐Fodrin fragmentation (β‐actin was used for normalization). TAT‐MTScs‐FXN caused reduction in α‐fodrin cleavage as judged by the decrease of fodrin fragments (150 and 120 kD) in a dose‐dependent manner. (B) Histogram showing the decrease in relative amounts of fragmented α‐fodrin shown in A as function of the amount of TAT‐MTScs‐FXN added to cultures. (C) α‐fodrin cleavage after 5 days analysed in Scr, Fxn1 and Fxn2 cells treated with 7 μg/ml TAT‐MTScs‐FXN or vehicle solution 12 or 48 hrs after lentiviral transduction. The histogram in (D) represents the values of fodrin fragments shown in (C) to illustrate the differences of adding the compound at 12 or 48 hrs. Values are referred to untreated control (Scr) culture. In (E), procaspase 9 levels are shown in Scr, Fxn1, Fxn2 treated with TAT‐MTScs‐FXN and untreated. Note that the decreased amounts in untreated Fxn1 and Fxn2 are re‐established by TAT‐MTScs‐FXN addition. The histogram in (F) represents the values shown in (E). Asterisks (*) show significant values compared with control conditions (Scr); bars with # indicate significant differences with respect to the corresponding untreated control culture. Error bars represent mean ± S.E.M. In all figures, N is at least n = 4.
