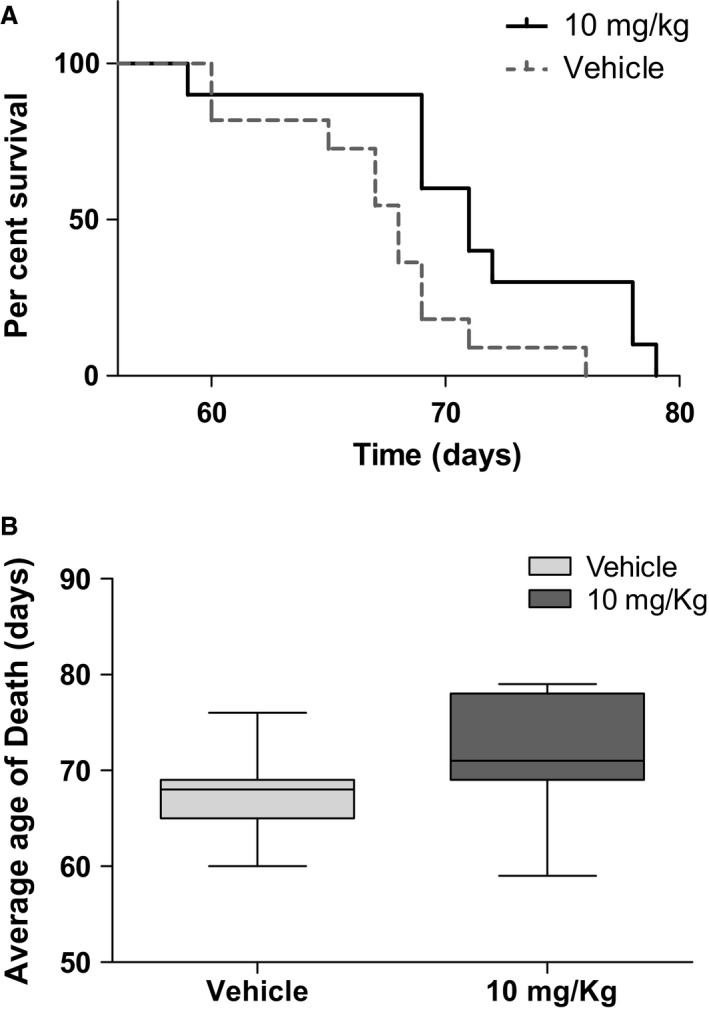
Figure 10.

Survival of TAT‐MTScs‐Frataxin‐treated MCK mice. (A) Kaplan–Meier curve generated by GraphPad Prism showing the lifespan increase in MCK‐conditional mouse model treated with TAT‐MTScs‐FXN, P = 0.0162 using log‐rank (Mantel–Cox) test. (B) Age of death, average was calculated using Gehan–Breslow–Wilcoxon test generated by GraphPad Prism, P = 0.0251. Mice treated with 10 mg/kg of TAT‐MTScs‐FXN or vehicle (IP injection) were tested for survival (as described in Materials and methods). N = 11 for each group.
