
Figure 8.
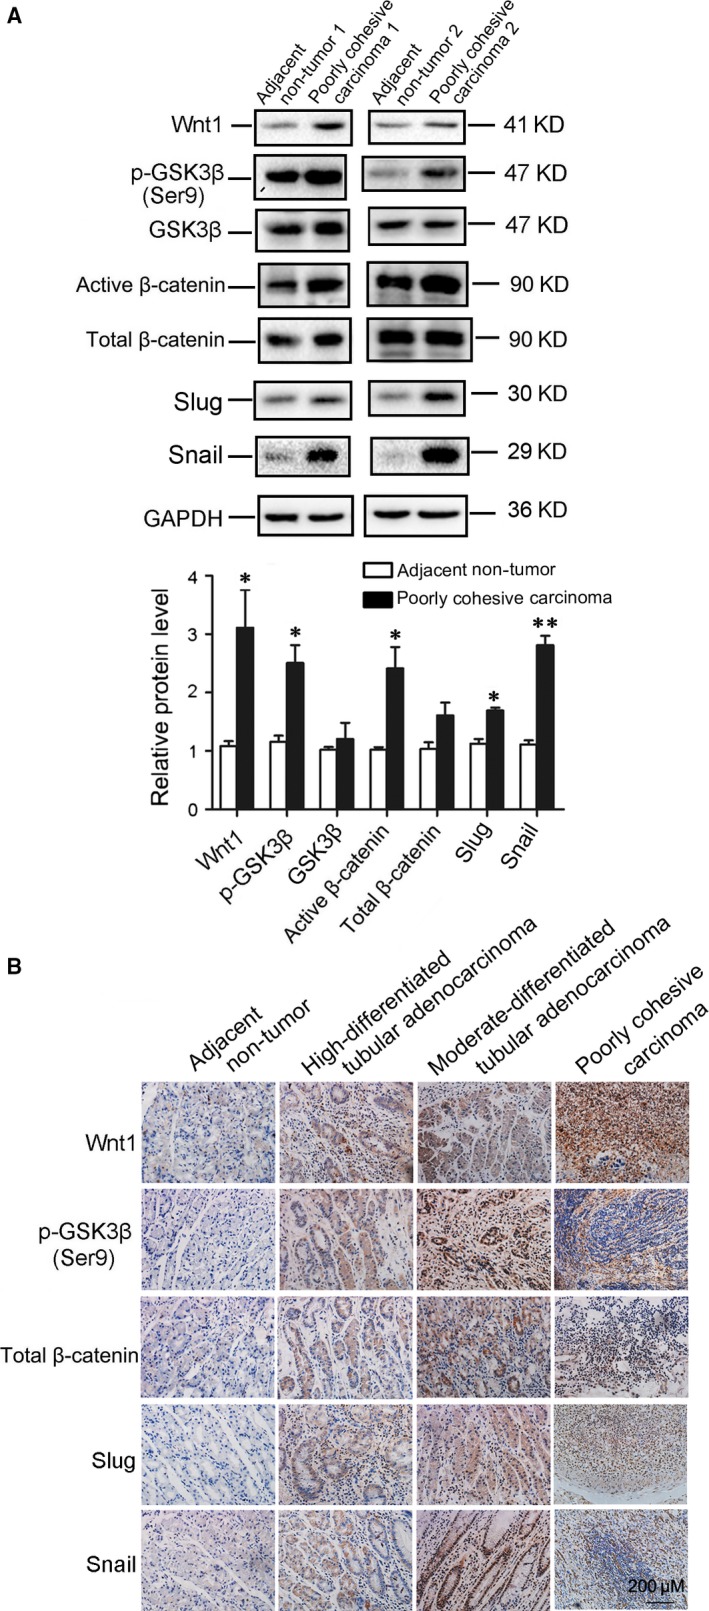
The relative levels of the key molecules of Wnt/β‐catenin signalling were confirmed in primary gastric cancer specimens. (A) Representative Western blot gel documents and summarized data showing the expression levels of Wnt1, phosphorylated GSK3β, active β‐catenin, Slug and Snail in poorly cohesive carcinoma tissues. (B) Representative immunohistochemical staining showing the expression of Wnt1, phosphorylated GSK3β, active β‐catenin, Slug and Snail in poorly cohesive carcinoma tissues. *P < 0.05, **P < 0.01, versus adjacent non‐tumour tissues (n = 5).