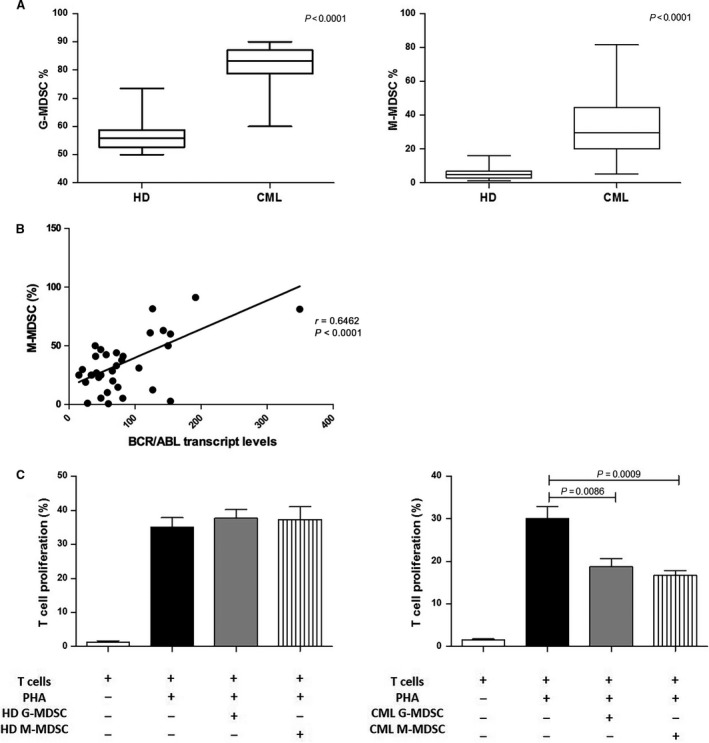
Figure 1.

Increased frequency of MDSC in untreated CML patients. (A) The percentages of circulating G‐MDSC and M‐MDSC were quantified in the peripheral blood of HD and newly diagnosed patients with CML by flow cytometry. Flow cytometry analysis was performed with gates set on either CD11b+ CD33+ CD14− HLA‐DR − (G‐MDSC) or CD14+ HLA‐DR − (M‐MDSC) cell populations. The bars represent the standard error of the mean. (B) Correlation analyses of the peripheral M‐MDSC count with BCR/ABL transcript levels calculated using the Pearson's correlation analysis. (C) Granulocytic and monocytic MDSC‐mediated T cell suppression in autologous cocultures. MDSC was previously tested for cell viability using cytofluorimetric analysis. Mean frequency of CD3+ CFSE dim cells ± S.D. from four independent experiments in duplicate is shown.
