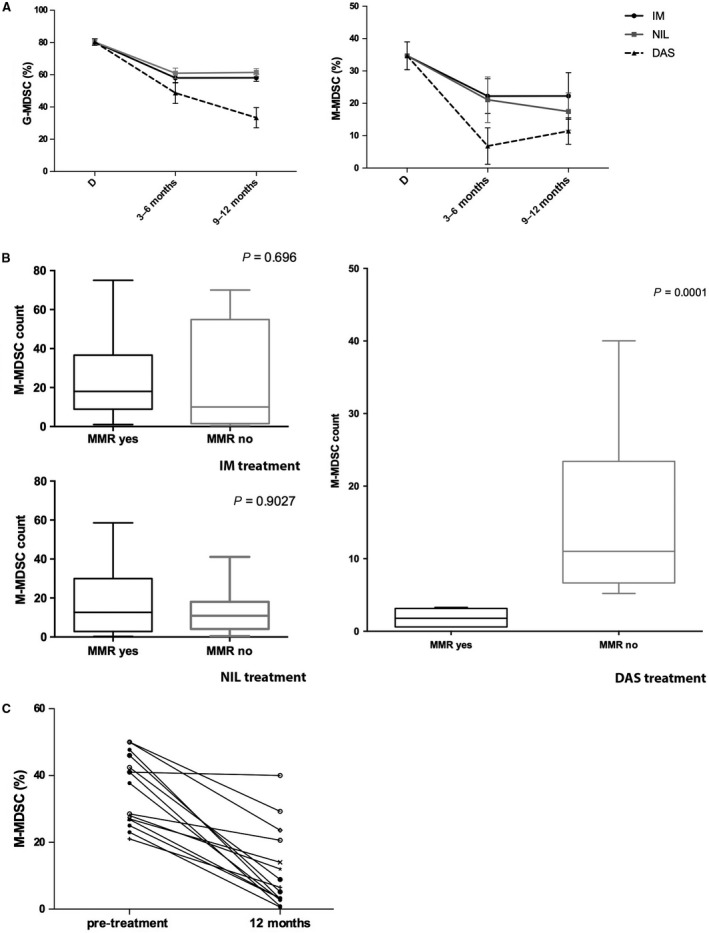
Figure 2.

MDSC after TKI therapy. (A) Changes in circulating G‐MDSC and M‐MDSC in CML patients treated with IM, NIL or DAS. The bars represent the standard error of the mean. G‐MDSC at 3–6 and 9–12 months after IM, NIL and DAS: P < 0.0001. M‐MDSC after 3–6 months of DAS therapy: P < 0.05; after 9–12 months of DAS treatment: P < 0.01. (B) The percentage of M‐MDSC was compared between the MMR and no MMR groups. The bars represent the standard error of the mean. Statistical difference was calculated using Mann–Whitney U‐test. (C) M‐MDSC count for patients at diagnosis and after 12 months of therapy with DAS. Lines with empty circle represent patients no in MMR at 12 months. MMR, major molecular response; BCR‐ABL is ≤0.1%.
