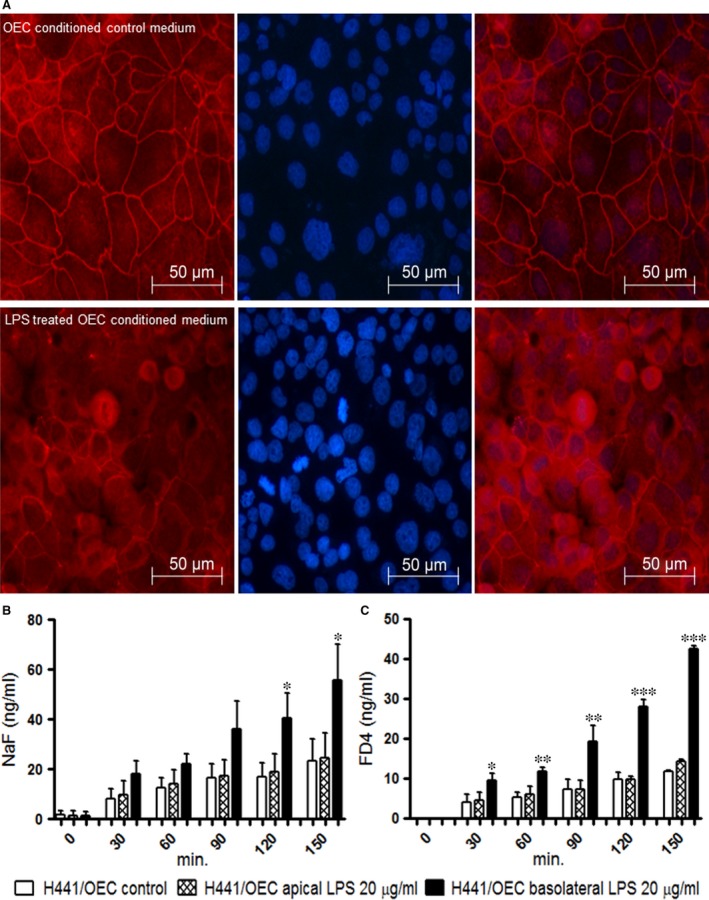
Figure 3.

(A, B) ZO‐1 expression in H441 monocultures treated with OEC conditioned medium (A) H441 cells treated with conditioned OEC control, (B) H441 cells treated with conditioned medium from OEC (10 μg/ml of LPS). (C, D) Transport of sodium fluorescein and FD4 across cell bilayers of H441 co‐cultures with OEC after 48 hrs treatment with 20 μg/ml of LPS. (C) Paracellular transport of sodium fluorescein in co‐cultures from apical to basolateral compartment after exposure to 20 μg/ml of LPS either from apical or basolateral compartment (D) Paracellular transport of FD4 in co‐cultures from apical to basolateral compartment after exposure to 20 μg/ml of LPS either from apical or basolateral compartment. Results are shown as means + S.D. of three independent experiments (*P < 0.05, **P < 0.01 and ***P < 0.001, annova).
