
Figure 1.
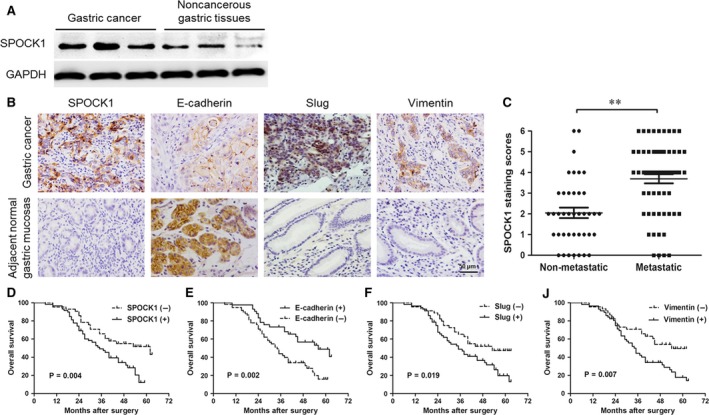
Expressions of SPOCK1 and EMT in gastric cancer and para‐carcinoma tissue, and survival curves. (A) Comparison of SPOCK1 expression between gastric cancer and noncancerous gastric tissues by Western blot assay. GAPDH was used as internal control. (B) Detection of SPOCK1, E‐cadherin, Slug and Vimentin expressions in gastric cancer tissues and adjacent normal gastric mucosas by immunohistochemical stainings. (C) The average staining scores of SPOCK1 expression in patients with or without metastasis. (D‐J) Survival curves of gastric cancer patients with SPOCK1, E‐cadherin, Slug or Vimentin expression. **P < 0.001. Scale bar = 50 μm.