Figure 2.

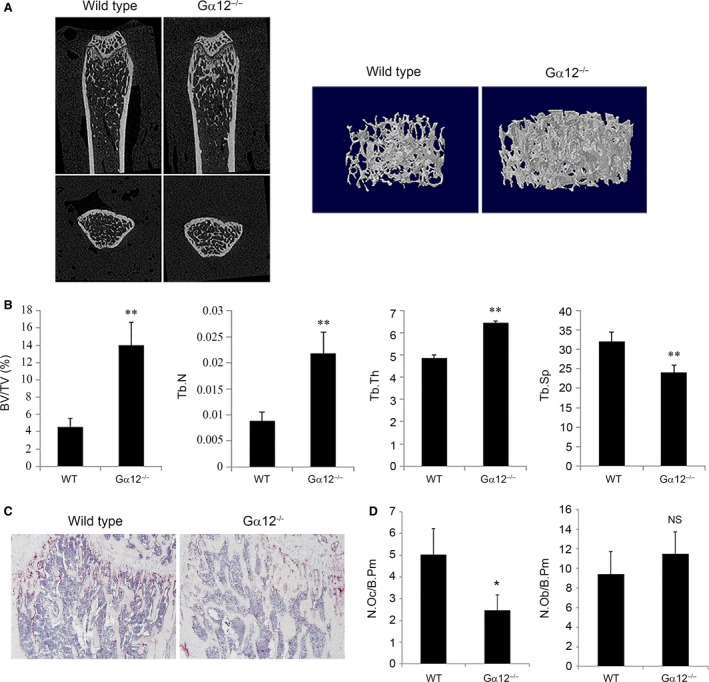
Gα12‐knockout mice show osteopetrotic phenotype. (A and B) Femurs from 9‐week‐old WT and Gα12−/− male mice were subjected to μCT analysis. (A) Representative coronal and horizontal images and three‐dimensional images of trabeculae of WT and Gα12−/− mice are shown. (B) Bone parameters of trabecular bone volume per tissue volume (BV/TV), trabecular thickness (Tb.Th), trabecular number (Tb.N) and trabecular separation (Tb.Sp) were analysed with a μCT analysis program (n = 4 per group). (C) For histological analysis, decalcified femurs were sectioned and stained for TRAP activity and counter‐stained with haematoxylin. (D) Osteoclasts and osteoblasts were counted with Osteomeasure software. NS, non‐significance versus WT. N.OC, number of osteoclasts; N.OB, number of osteoblasts; B.Pm, bone perimeter. Data are presented as means ± standard deviations (S.D.). *P < 0.05; **P < 0.005.
