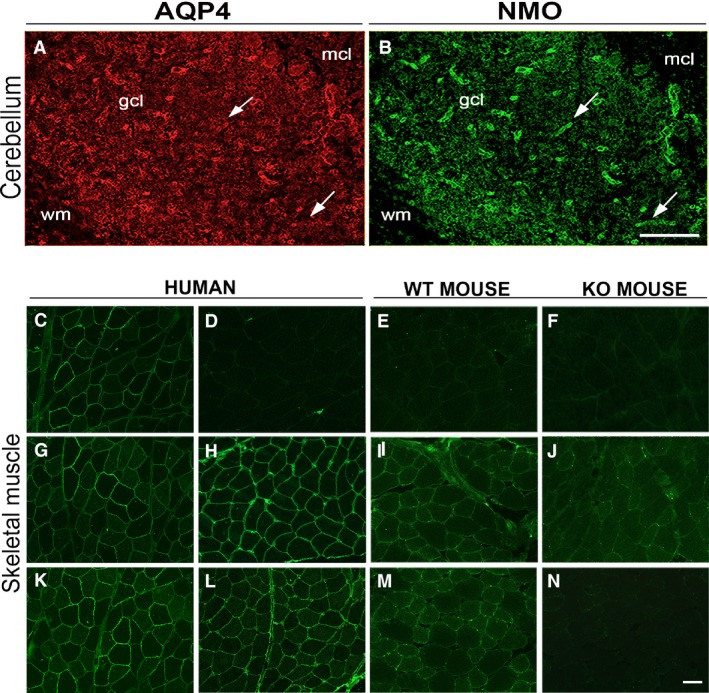
Figure 1.

NMO‐IgG immunofluorescence analysis of rat cerebellum and skeletal muscle. Top, staining of the cerebellum with AQP4 (A) and NMO‐IgG (B). gcl, granular cell layer; mcl, molecular cell layer. Arrows indicate staining of pericapillary astrocyte endfeet. Note the selective labelling of the NMO‐IgG to the astrocyte endfeet processes. Bottom, staining of AQP4 and NMO‐IgG of the skeletal muscles. (C, G and K) show human muscle sections stained with AQP4 commercial antibodies. (D–F) staining with an NMO serum that gave no signal. (H–J) staining with an NMO serum that produced a non‐specific signal (positive in both WT and AQP4‐KO mice). (L–N) staining with an NMO serum that presented a specific stain. Note, in this latter case, the absence of staining in skeletal muscle from AQP4‐KO mouse (N). Scale bar, 50 μm.
