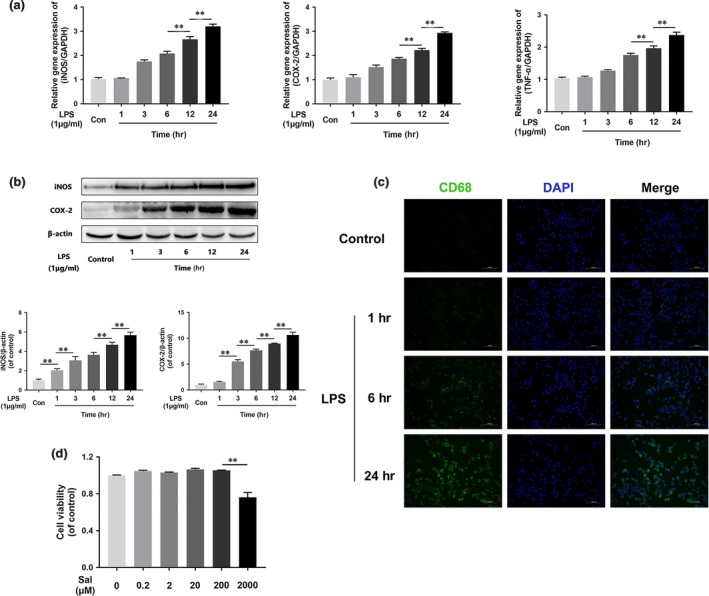
Figure 3.

LPS induces M1 microglia polarization and pro‐inflammatory mediator release. (A) iNOS, COX‐2 and TNF‐α gene expression levels in BV‐2 cells. Gene expression levels were assessed via qRT‐PCR and normalized to GAPDH gene expression levels. Related gene expression levels were up‐regulated by LPS stimulation in a time‐dependent manner. (B) Representative Western blots of and quantitative data for iNOS, COX‐2 and β‐actin expression in each group of microglia. iNOS and COX‐2 protein expression levels were enhanced by LPS stimulation. (C) Immunofluorescence staining for CD68 in each of group microglia (scale bar: 100 μm). LPS induced M1 microglia polarization in a time‐dependent manner. Densitometric analysis of all Western blot bands, whose densities were normalized to those of β‐actin. Data are presented as the mean ± S.D., n = 3 independent experiments. Significant differences between groups are indicated as *P < 0.05 and **P < 0.01.
