
Figure 4.
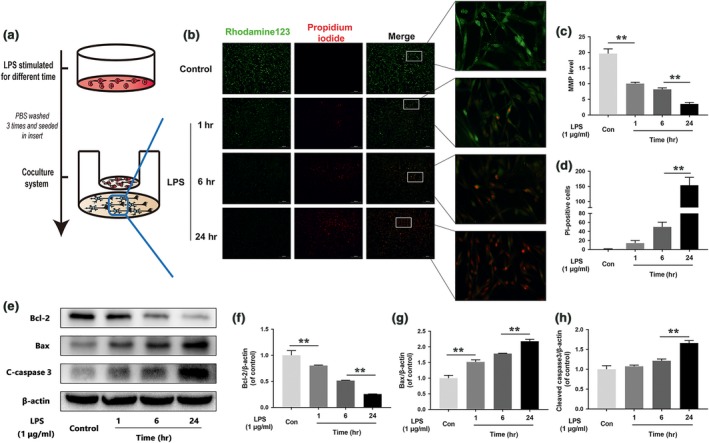
M1 microglia polarization induces neuronal apoptosis. (A) Schematic of BV‐2 cell treatments and the coculture system. BV‐2 cells were stimulated by LPS for 24 hrs, then washed three times and cocultured with PC12 cells. (B, C, D) Fluorescence staining results pertaining to MMP, as demonstrated by rhodamine 123 and PI. Representative images of stained neurons from the indicated groups (scale bar: 200 μm). MMP decreased significantly, and neuronal death increased in cells cocultured with M1 microglia. (E, F, G, H) Representative Western blots of and quantitative data for Bcl‐2, Bax, cleaved caspase 3 and β‐actin expression in each group of neurons. The neuronal apoptosis induced by mitochondria dysfunction was significantly increased in cells cocultured with M1 microglia. Densitometric analysis of all Western blot bands, whose densities were normalized to those of β‐actin. Data are presented as the mean ± S.D. and, n = 3 independent experiments. Significant differences between groups are indicated as *P < 0.05 and **P < 0.01.