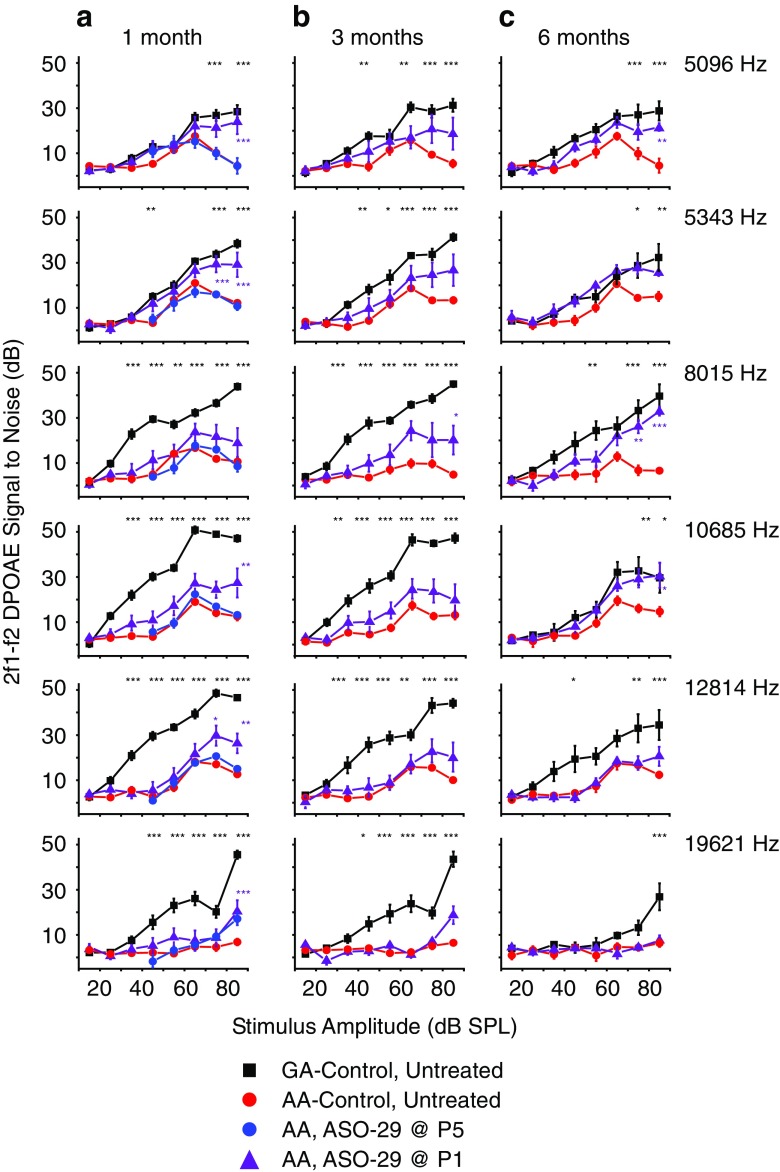
Fig. 2.
Analysis of DPOAE signal to noise ratios in Ush1c mice treated with a single dose of ASOs. Signal to noise ratio (SNR) plots at the primary tone pairs tested at 1 month (a), 3 months (b), and 6 months (c) of age for Ush1c 216AA mice treated with 300 mg/kg of ASO-29 one time at P1 (purple line, n = 8, 6, and 6 at 1, 3, and 6 months of age, respectively) or P5 (blue line, n = 5) and untreated 216AA (red line, n = 15, 12, and 7 at 1, 3, and 6 months of age, respectively) and untreated 216GA (black line, n = 11, 11, and 8 at 1, 3, and 6 months of age, respectively) control mice. Frequency tone pairs: f1 = 6363 Hz, f2 = 7630 Hz (2f1-f2 = 5096 Hz); f1 = 6672 Hz, f2 = 8000.5 Hz (2f1-f2 = 5243 Hz); f1 = 10,008 Hz, f2 = 12,001 Hz (2f1-f2 DP at 8015 Hz); f1 = 13,342.5 Hz, f2 = 15,999 Hz (2f1-f2 DP at 10685 Hz); f1 = 16,000 Hz, f2 = 19,186 Hz (2f1-f2 DP at 12814 Hz); f1 = 24,500 Hz, f2 = 29,378.5 Hz (2f1-f2 DP at 19621). SNRs are increased at some frequencies at all ages tested with a single ASO treatment at P1, but not P5. Error bars represent SEM. For each frequency, asterisks indicate significant difference (*P ≤ 0.05, **P ≤ 0.01, ***P ≤ 0.001, ANOVA with Tukey-Kramer post-test) from control mutant thresholds (red). P values, specific test, test value, and degrees of freedom for all comparisons in this dataset are shown in Supplemental Table Comparison 1. f, frequency; DP, distortion product; DPOAE, distortion product otoacoustic emission; Hz, Hertz; dB, decibel; SPL, sound pressure level; Het, heterozygote

