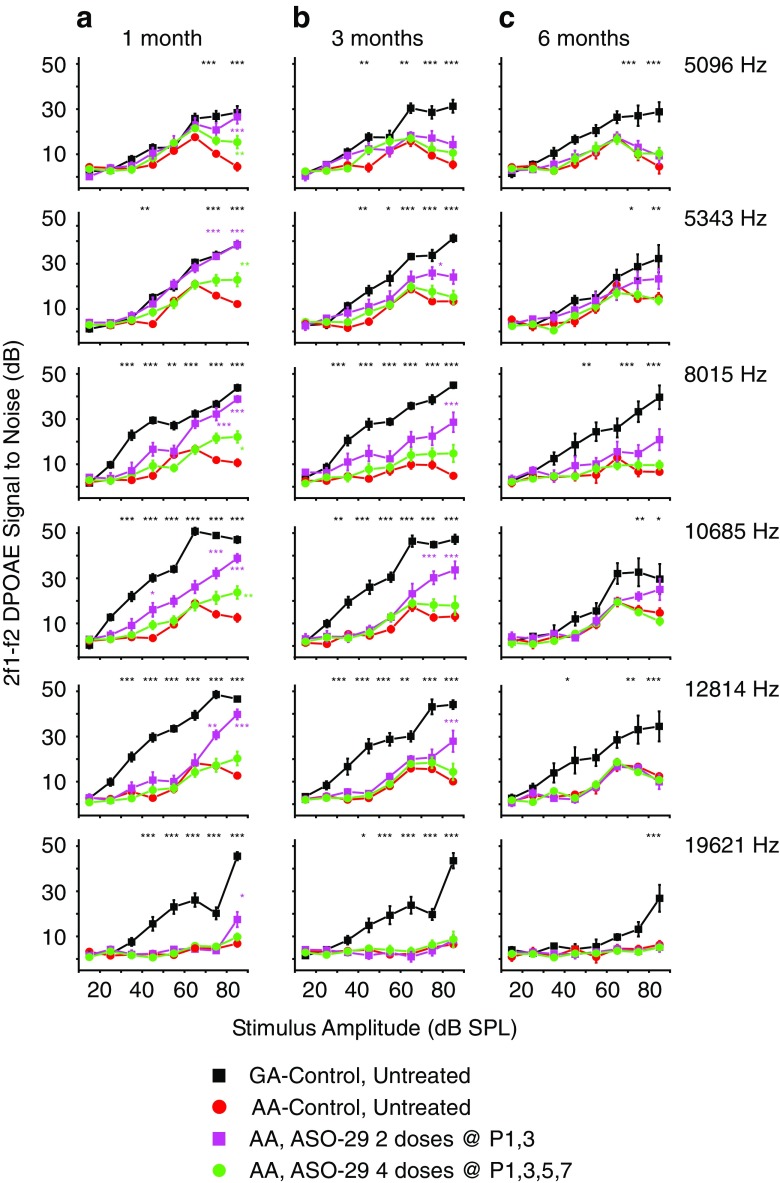
Fig. 3.
Analysis of DPOAE signal to noise ratios in Ush1c mice treated with multiple doses of ASOs. Signal to noise ratio (SNR) plots at the primary tone pairs tested at 1 month (a), 3 months (b), and 6 months (c) of age for Ush1c 216AA mice treated with 300 mg/kg of ASO-29 twice at P1 and 3 (P1, 3, pink line, n = 9, 8, and 7 at 1, 3, and 6 months of age, respectively) or four times at P1, 3, 5, and 7 (P1, 3, 5, 7, green line, n = 17, 13, and 12 at 1, 3, and 6 months of age, respectively) and untreated 216AA (red line, n = 15, 12, and 7 at 1, 3, and 6 months of age, respectively) and 216GA (black line, n = 11, 11 and 8 at 1, 3 and 6 months of age, respectively) control mice. Frequency tone pairs: f1 = 6363 Hz, f2 = 7630 Hz (2f1-f2 = 5096 Hz); f1 = 6672 Hz, f2 = 8000.5 Hz (2f1-f2 = 5243 Hz); f1 = 10,008 Hz, f2 = 12,001 Hz (2f1-f2 DP at 8015 Hz); f1 = 13,342.5 Hz, f2 = 15,999 Hz (2f1-f2 DP at 10685 Hz); f1 = 16,000 Hz, f2 = 19,186 Hz (2f1-f2 DP at 12814 Hz); f1 = 24,500 Hz, f2 = 29,378.5 Hz (2f1-f2 DP at 19621). SNRs are increased at some frequencies at 1 and 3 months of age with multiple ASO treatments in the first week of life. The number of treatments (doses) is indicated. Error bars represent SEM. For each frequency, asterisks indicate significant difference (*P ≤ 0.05, **P ≤ 0.01, ***P ≤ 0.001, ANOVA with Tukey-Kramer post-test) from control mutant thresholds (red). P values, specific test, test value, and degrees of freedom for all comparisons in this dataset are shown in Supplemental Table Comparison 1 . f, frequency; DP, distortion product; DPOAE, distortion product otoacoustic emission; Hz, Hertz; dB, decibel; SPL, sound pressure level; Het, heterozygote

