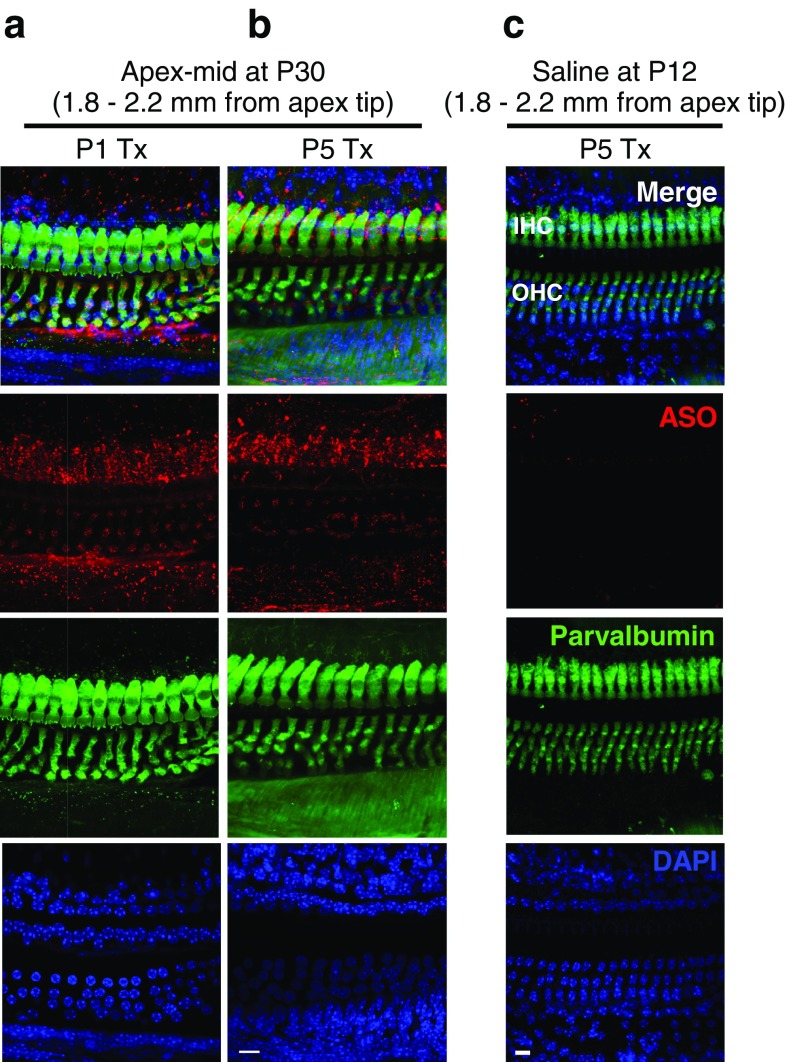
Fig. 9.
Localization of ASOs in auditory hair cells at P30 after systemic treatment in Ush1c mice. Immunofluorescent labeling of ASO-29 (red) in HCs (green) at the a, b apex-mid turn at P30 after ASO treatment at P1 (a) or P5 (b). c Immunofluorescent image at the apex-middle turn of P5 vehicle-treated (saline), control littermate 1 week after P5 ASO treatment (P12). Scale bars indicate 10 μm. IHC, inner hair cell; OHC, outer hair cell; ASO, antisense oligonucleotide

