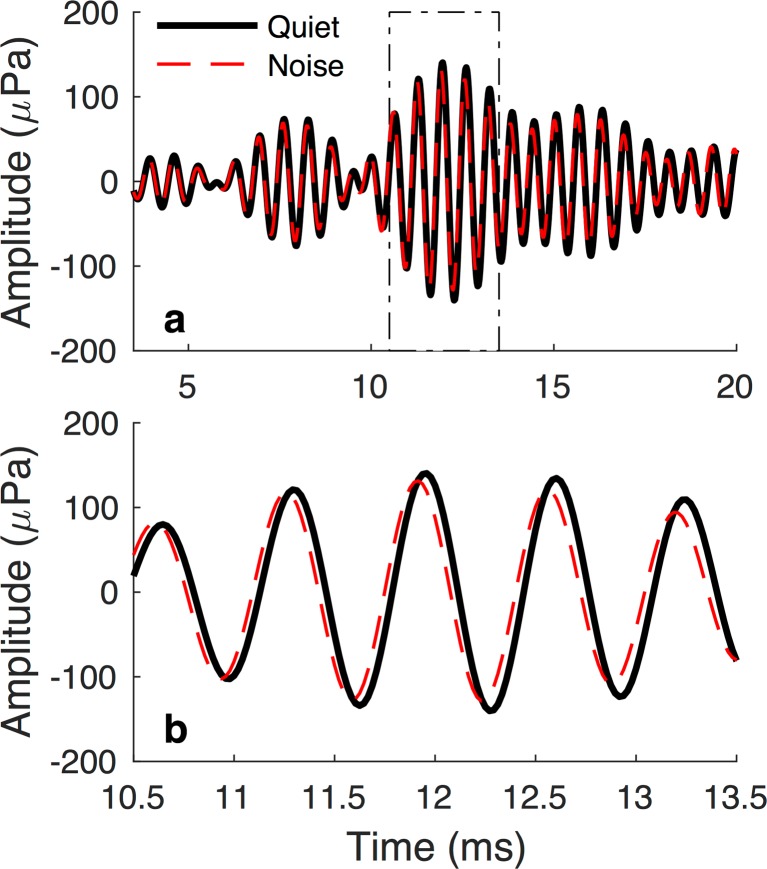
Fig. 1.
Example of an MOC-induced phase change to the TEOAE waveform. a Emission waveforms measured in Quiet and Noise conditions (thick, solid black line and thin, broken red line, respectively) across the duration of the TEOAE analysis window. b Waveforms constrained to a time window spanning 10.5–13.5 ms post-stimulus. Activation of the MOCR resulted in a slight amplitude decrease and phase shift

