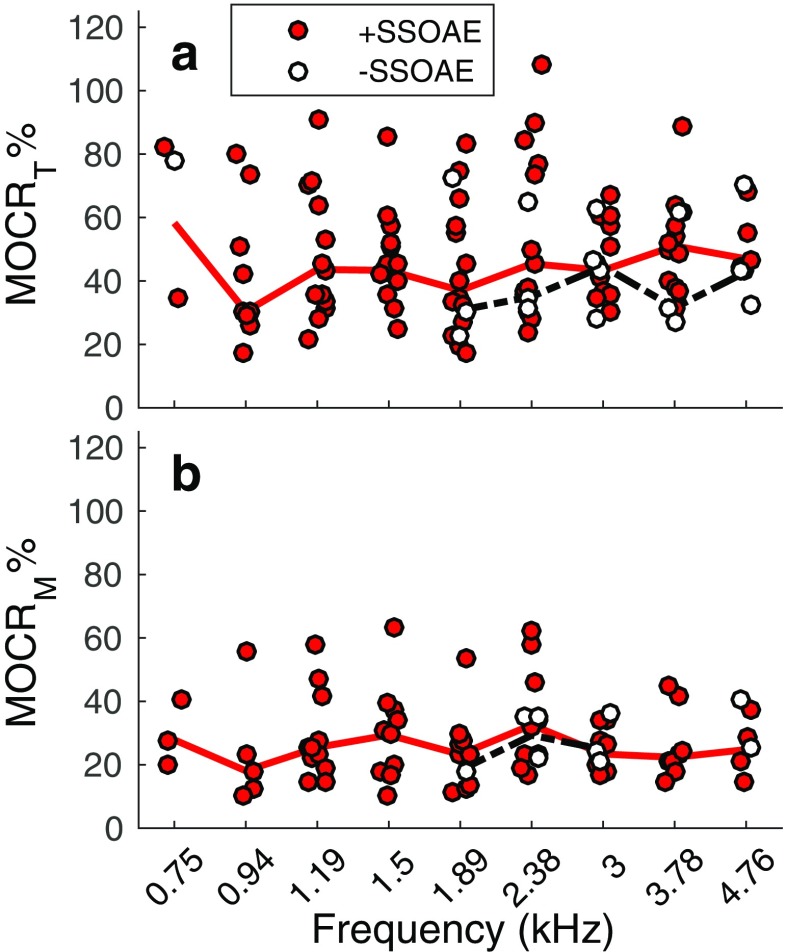
Fig. 5.
MOCR% estimated from PMOCT (MOCRT%, a) and PMOCM (MOCRM%, b) within different frequency bands for instances where SSOAEs were present and absent. The solid lines in each plot indicate the frequency-specific median values of MOCR% for the +SSOAE data, whereas the broken lines indicate the median values of MOCR% for −SSOAE data

