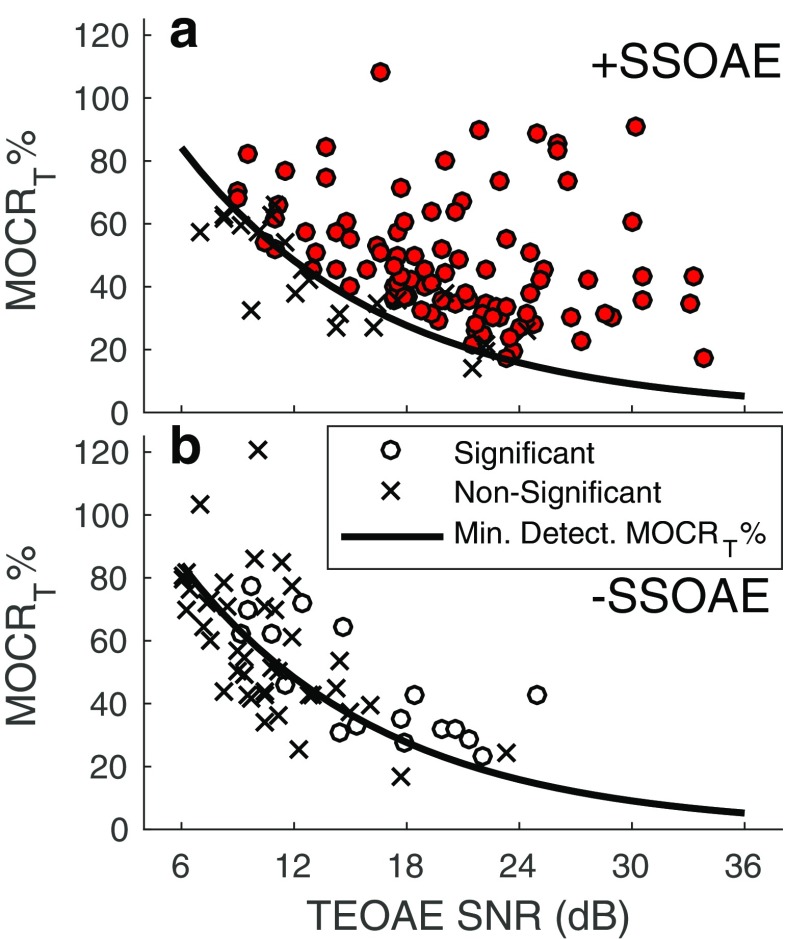
Fig. 7.
Statistically significant and non-significant values of MOCRT% as a function of TEOAE SNR when SSOAEs were present (a) and absent (b). The circle markers indicate a statistically significant MOC-induced change to the TEOAE, whereas cross markers indicate a non-significant change. Overlaid on the plots is the 1st-order exponential fit describing the minimum-detectable MOCRT% as a function of TEOAE SNR (from Fig. 6)

