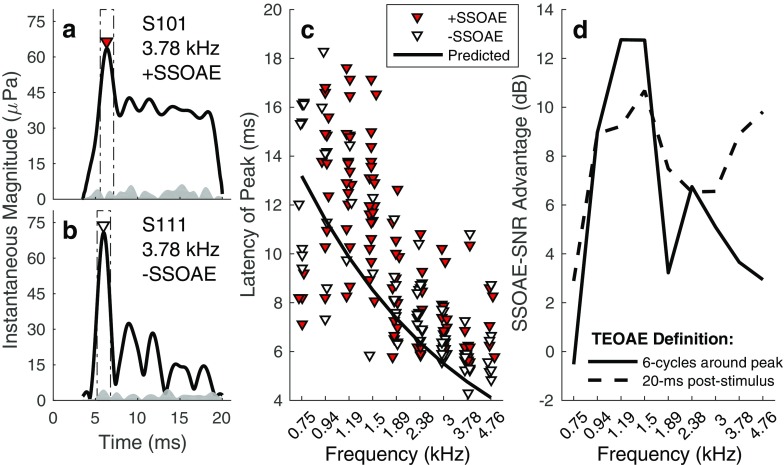
Fig. 8.
a, b Examples of TEOAE time-waveform envelopes in frequency bands with and without SSOAEs, respectively. Each panel shows the 3.78-kHz band emission waveform envelope measured in Quiet (solid line) and an estimate of the noise (shaded region). In both cases, the emission exhibits an amplitude peak around 6 ms (indicated by the inverted triangle marker). Following the amplitude peak, emission energy persists at a steady level throughout the duration of the analysis window for the subject with a SSOAE. In contrast, for the subject lacking a SSOAE, emission energy decayed into the noise floor within the 20-ms window. c Latencies of the emission’s peak amplitude. Overlaid on the plot is the predicted relationship between SFOAE latency and frequency from Shera and Guinan (2003); see Eq. 5. d SNR advantage associated with present SSOAEs for different definitions of the TEOAE. The solid line indicates data for when the TEOAE is defined over a duration of 6 cycles re: latency of the peak amplitude. The broken line indicates data for when the TEOAE is defined based on the energy within an analysis window extending to 20-ms post-stimulus

