Fig. 3.
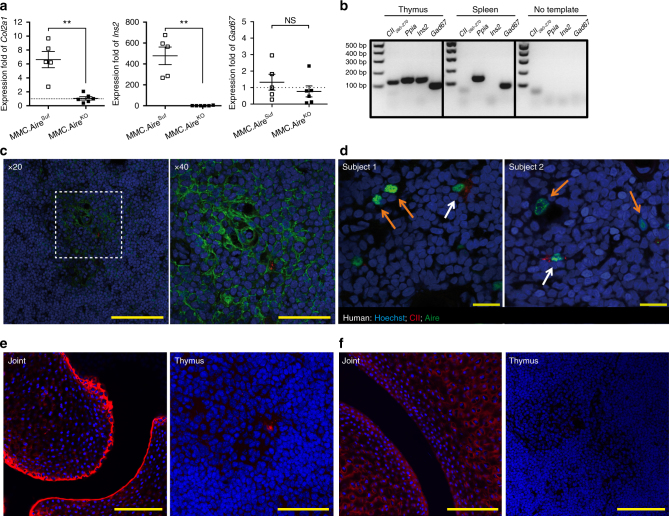
The CII epitope is expressed in thymic stromal cells of mice and humans. a cDNA derived from thymi of MMC.AireSuf (n = 5) and MMC.AireKO (n = 6) was prepared and expression of CII (Col2a1) was determined by quantitative RT-PCR. Aire-dependent (Ins2) and Aire-independent (Gad67) genes were used as controls. Data were normalized to the expression of cyclophilin A (Ppia) and calibrated with one MMC.AireKO sample. Mean ± SEM is shown. b Qualitative expression analysis of the immunodominant T cell epitope CII260–270 by RT-PCR on cDNA prepared from whole thymi of 3-week-old mice. As negative control, cDNA was prepared from spleen cells of wild-type mice. Ins2 and Gad67 were used as controls for genes expressed either in the thymus alone or in both thymus and spleen, respectively. Ppia was used as housekeeping gene, whereas no template samples were used as negative controls. c MMC thymus stained for DNA (Hoechst, in blue), keratin 5 (in green), and CII (mAb cocktail, in red). Scale bar in left panel, 100 μm; in right panel, 50 μm. d Human thymus sections from two different subjects stained with Hoechst (in blue), anti-AIRE (in green), and anti-CII (in red). Orange arrows indicate thymic epithelial cells positive for AIRE alone. White arrows indicate thymic epithelial cell positive for both AIRE and CII. Scale bar indicates 20 μm. (e) Stain of joint and thymus with Hoechst (blue) and anti-CII (mAb cocktail, red) or (f) Hoechst (blue) and anti-PTM CII (T8 mAb, red), from an MMC mouse. Scale bars indicate 100 μm for left panel of e and both panels of f, and 50 μm in right panel of e. p values were calculated using Mann–Whitney U test. **p < 0.01; NS not significant

