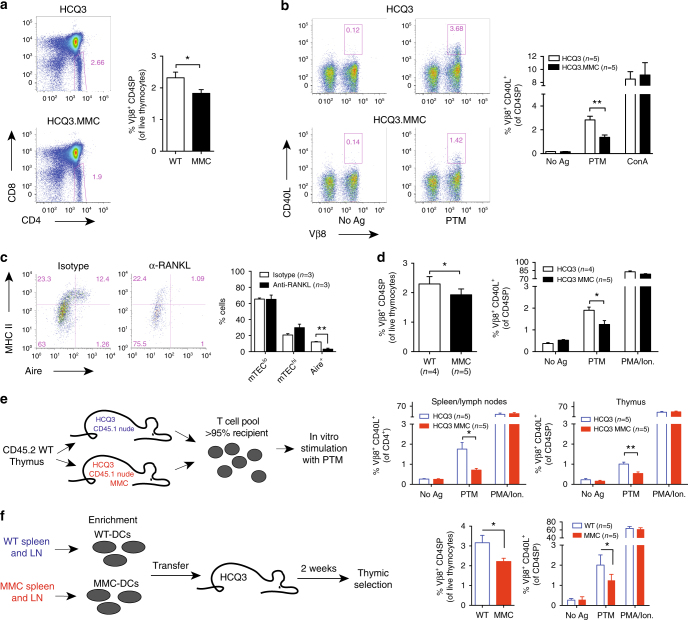
Fig. 5.
Peripheral antigen migration mediates thymic tolerance to the PTM epitope. Frequency of (a) CD4 single-positive and (b) CD4+CD40L+ thymocytes from naive HCQ3 and HCQ3.MMC mice, after antigen stimulation in vitro. Cells left unstimulated (No Ag) or concanavalin A (ConA) stimulated were used as negative and positive controls, respectively. c Treatment with anti-RANKL antibody induces selective depletion of Aire-expressing mTECs in the thymus. Indicated number of mice was treated with 100 μg of anti-RANKL or an isotype control antibody every second day for 2 weeks, and thymi were collected and analyzed the following week. Dot plots show representative examples of outcome following antibody treatment. d Treatment with anti-RANKL antibody does not alter central tolerance of HCQ3 transgenic T cells in HCQ3.MMC mice as determined by frequencies of CD4SP thymocytes (left) or up-regulation of CD40L following ex vivo stimulation with the PTM CII260–270 peptide. Cells cultured in the absence of antigen (No Ag) and in the presence of PMA/ionomycin (PMA/Ion) were used as negative and positive controls, respectively. e Three- to four-week-old HCQ3-nude and HCQ3.MMC-nude mice were grafted with neonate thymus from wild-type mice. Thymus and pooled spleen and lymph nodes from individual mice were recovered 14–21 weeks after transplantation, when recipient-derived T cells constituted >95% of the peripheral T cell pool (as determined by CD45.1 expression) and investigated for up-regulation of CD40L, as described in d. f CD11c+ cells were enriched from spleens and lymph nodes of naive MMC or WT donors and transferred to the indicated number of naive HCQ3 mice. Two weeks later, recipient mice were sacrificed and thymocytes were prepared and investigated ex vivo for frequency of CD4SP cells (left) and up-regulation of CD40L, as described for in d. Data from two pooled experiments are shown. p values were calculated by unpaired t test. *p < 0.05; **p < 0.01. Gating strategies used for analysis of flow cytometry data are shown in Supplementary Fig. 8

