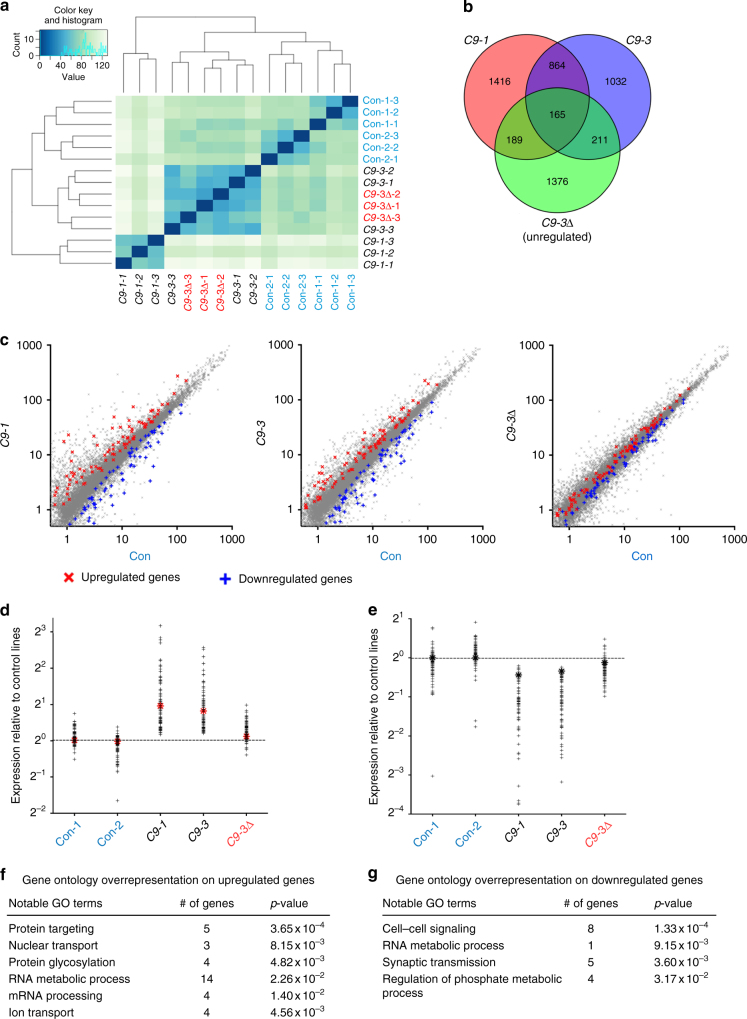
Fig. 4.
RNA-Seq analysis on C9ORF72 mutant MNs. a Heat map and dendrogram depicting hierarchical clustering of RNA sequencing reads from controls (Con-1, Con-2), C9ORF72 mutant (C9-1, C9-3), and C9-3Δ MNs. b Venn diagram depicting identification of differentially expressed genes between two mutant C9ORF72 MNs and control MNs. Central intersect represents 165 dysregulated genes compared to both control and gene-corrected MNs. c Scatter plot showing comparison of transcriptome reads of two independent C9ORF72 mutant MNs and C9-3Δ MNs to controls. Red crosses denote significantly upregulated genes and blue crosses denote significantly downregulated genes (p < 0.05, analysis performed using DESeq2). These dysregulated genes in C9ORF72 mutant MNs are reversed to control levels in C9-Δ MNs. d, e Graph depicting the spread of differentially regulated, upregulated (d), and downregulated (e) genes in mutant C9ORF72 MNs, red star denotes the levels of GluA1. f, g Gene ontology studies on upregulated (f) and downregulated genes (g)

