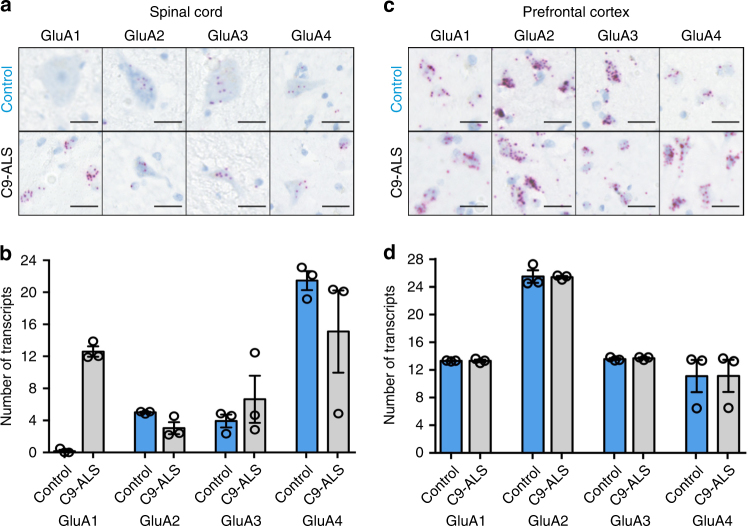
Fig. 7.
AMPAR subunit expression in post-mortem spinal cord of healthy patients and ALS patients with C9ORF72 repeat expansion. a Representative RNAscope® images showing the expression of AMPAR GluA1—four transcripts in the anterior horn of cervical spinal cord sections from an ALS patient (C9ORF72) and an age-matched healthy patient and reveals increased expression of GluA1 in ALS patient sample. Scale bar, 25 µm. b Quantification of the mean ± s.e.m. expression levels of AMPAR transcripts in spinal cord samples from three independent patients and controls. Note the lack of GluA1 transcript expression in control spinal cord samples and strong expression in patient samples. c Representative RNAscope images showing the expression of AMPAR GluA1—four transcripts in the prefrontal cortex from an ALS patient (C9ORF72) and an age-matched healthy patient. Scale bar, 25 µm. d Quantification of the mean ± s.e.m. expression levels of AMPAR transcripts in prefrontal cortex samples from three independent patients and controls showing equivalent expression of all transcripts

