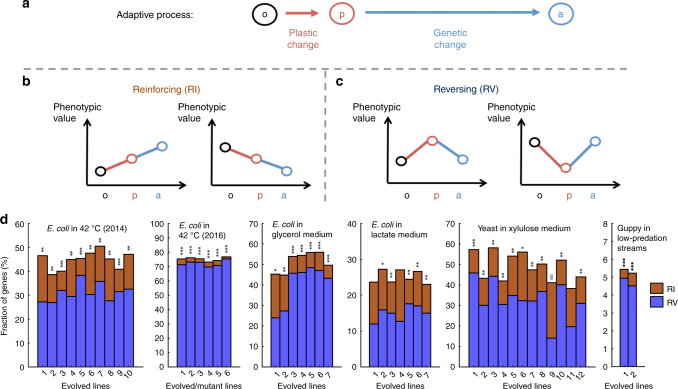
Fig. 1.
Gene expression changes in experimental evolution. a Phenotypic adaptation is studied by comparing the phenotypic values of a trait at three stages: ancestral organisms adapted to the original environment measured in the original environment (stage o); ancestral organisms measured in the new environment (stage p); and evolved organisms adapted to the new environment measured in the new environment (stage a). Plastic changes refer to changes from stage o to p, while genetic changes refer to changes from stage p to a. b A pair of plastic and genetic phenotypic changes of a trait are said to be reinforcing if both are larger than a preset cutoff and are in the same direction. c A pair of plastic and genetic phenotypic changes of a trait are said to be reversing if both are larger than a preset cutoff but are in opposite directions. d Fractions of genes with reinforcing (CRI) and reversing (CRV) expression changes, respectively, in experimental evolution. Organisms as well as the new environments to which the organisms were adapting to are indicated. Each bar represents an adaptation. The equality in the fraction of reinforcing and reversing genes in each adaptation is tested by a two-tailed binomial test. When CRV > CRI, P-values are indicated as follows: *P < 0.05; **P < 10−10; ***P < 10−100; when CRV < CRI, P-values are indicated as follows: oP < 0.05; ooP < 10−10; oooP < 10−100

