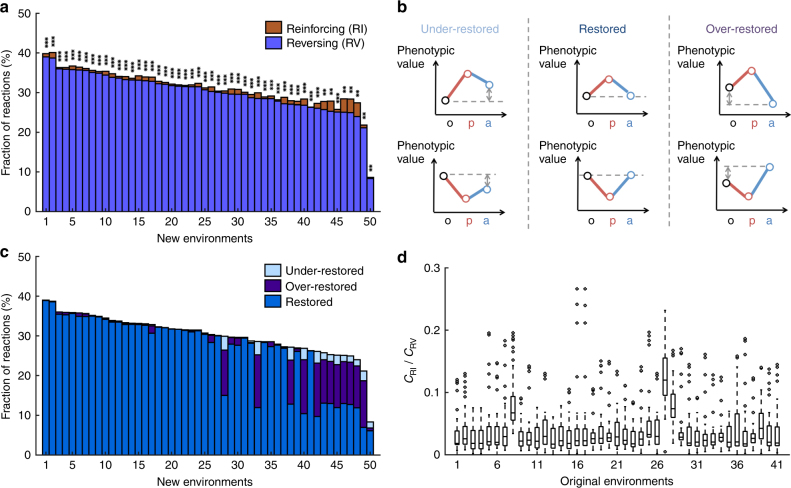
Fig. 2.
Predominance of flux reversion in the environmental adaptations of E. coli. a Fractions of reactions with reinforcing (CRI) and reversing (CRV) flux changes, respectively, in the adaptation from the glucose environment to each of 50 new environments. Each bar represents the adaptation to a new environment. The equality in the fraction of reinforcing and reversing reactions is tested by a two-tailed binomial test. When CRV > CRI, P-values are indicated as follows: *P < 0.05; **P < 10−10; ***P < 10−100; when CRV < CRI, P-values are indicated as follows: oP < 0.05; ooP < 10−10; oooP < 10−100. b Classification of reversion to three categories based on whether the phenotypic value in the original environment is under-restored, restored, or over-restored. c Fractions of the three categories of reversion in each of the 50 adaptations. d Fraction of reinforcing reactions relative to that of reversing reactions (CRI/CRV) in E. coli adaptations to at least 20 new environments from each of 41 original environments examined. The CRI/CRV ratios for all adaptations from each original environment are presented in a box plot, where the lower and upper edges of a box represent the first (qu1) and third (qu3) quartiles, respectively, the horizontal line inside the box indicates the median (md), the whiskers extend to the most extreme values inside inner fences, md ± 1.5(qu3 − qu1), and the circles represent values outside the inner fences (outliers)

