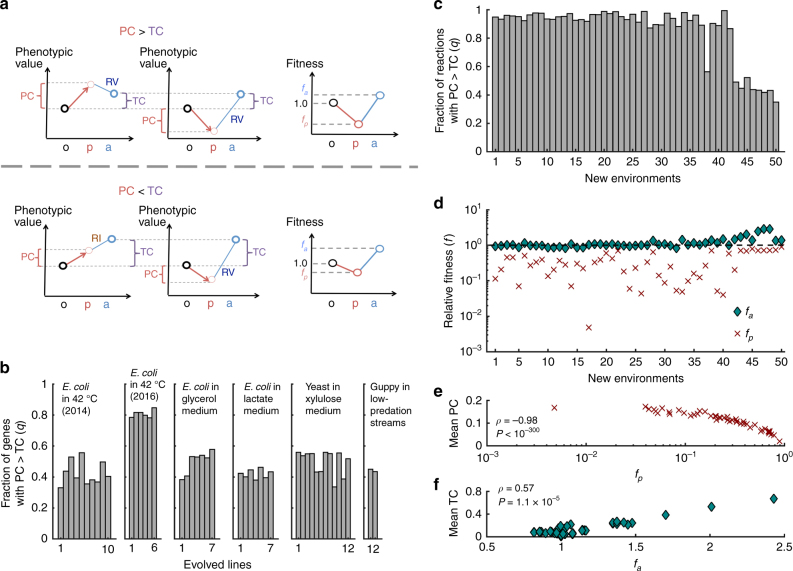
Fig. 3.
Cause of the preponderance of phenotypic reversion in adaptation. a Diagram illustrating the model. The upper part shows that if the plastic change (PC) is greater than the total change (TC), the genetic change (GC) must reverse the PC (the left and middle diagrams). One reason for PC > TC is that the fitness difference between organisms at stages o and p is greater than that between stages o and a (the right diagram). The lower part shows that if PC < TC, the GC either reinforces or reverses the PC (the left and middle diagrams). This may occur if the fitness difference between organisms at stages o and p is smaller than that between o and a (the right diagram) or if the phenotype is unassociated with fitness. b Fraction of genes showing expression PC > TC during each of 44 experimental evolutionary adaptations. c Fraction of reactions showing flux PC > TC during each of the E. coli metabolic adaptations from the glucose environment to the 50 new environments. d Fitness at stage p and that at stage a, relative to that at stage o, predicted by metabolic network analysis, for each of the 50 adaptations in c. The dotted line shows the fitness at stage o. e Mean PC across all fluxes negatively correlates with the relative fitness at stage p (fp) among the 50 adaptations in c. f Mean TC across all fluxes positively correlates with the relative fitness at stage a (fa) among the 50 adaptations in c

