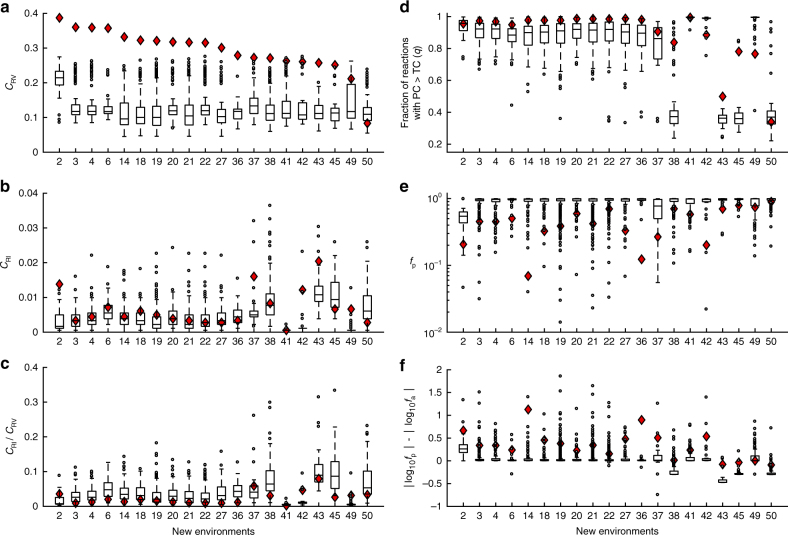
Fig. 4.
Predominance of flux reversion in random metabolic networks. Fractions of reactions showing flux reversion (CRV) (a), fractions of reactions showing flux reinforcement (CRI) (b), CRI/CRV ratios (c), fraction of reactions showing PC > TC (d), fp (e), and |log10fp| – |log10fa| (f) in the adaptations of random networks from the glucose environment to each of the 20 new environments examined. For each new environment, values estimated from different random networks are shown by a box plot, with symbols explained in the legend to Fig. 2d. The corresponding values for the E. coli iAF1260 network are shown by red diamonds

