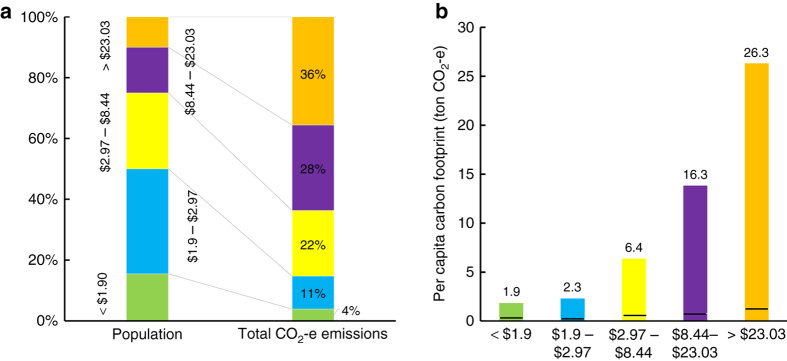
Fig. 1.
Global income and carbon distribution in 2010 for household final demand plus associated government expenditure and capital formation. a Global population share and global carbon contribution per expenditure category. Colors represent different expenditure categories and their respective shares of the global population and global carbon emissions. b Per Capita carbon footprint per expenditure category in tons of CO2-e. Dotted line separates the direct and indirect emissions for each consumer groups (lower part is the direct emissions and upper part is the indirect or upstream emissions in the supply chain)

