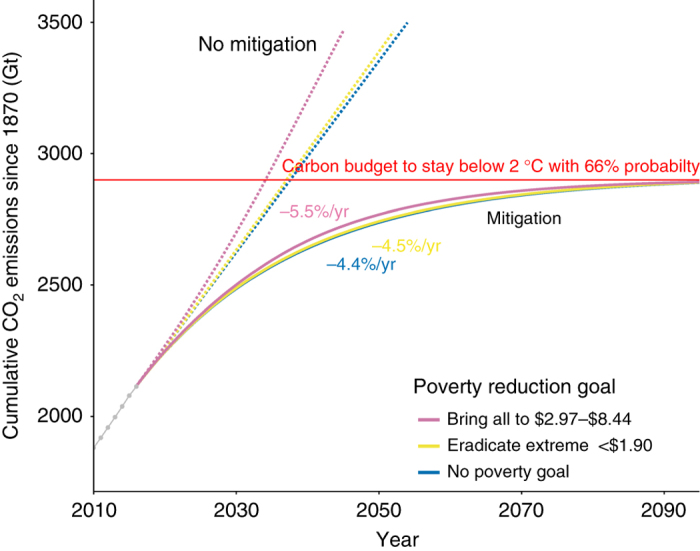
Fig. 4.

Historic cumulative global CO2 emissions from 1870 through 2015 and predicted paths. Gray dots before 2015 shows historical cumulative CO2 emissions since 1870 in Gigatons (Gt). Solid lines after 2015 shows predicted paths for each scenario and required annual reduction in carbon intensity in percent to stay below 2 °C above pre-industrial levels with 66% chance. Dotted lines after 2015 show predicted carbon emission paths if no mitigation measures are taken
