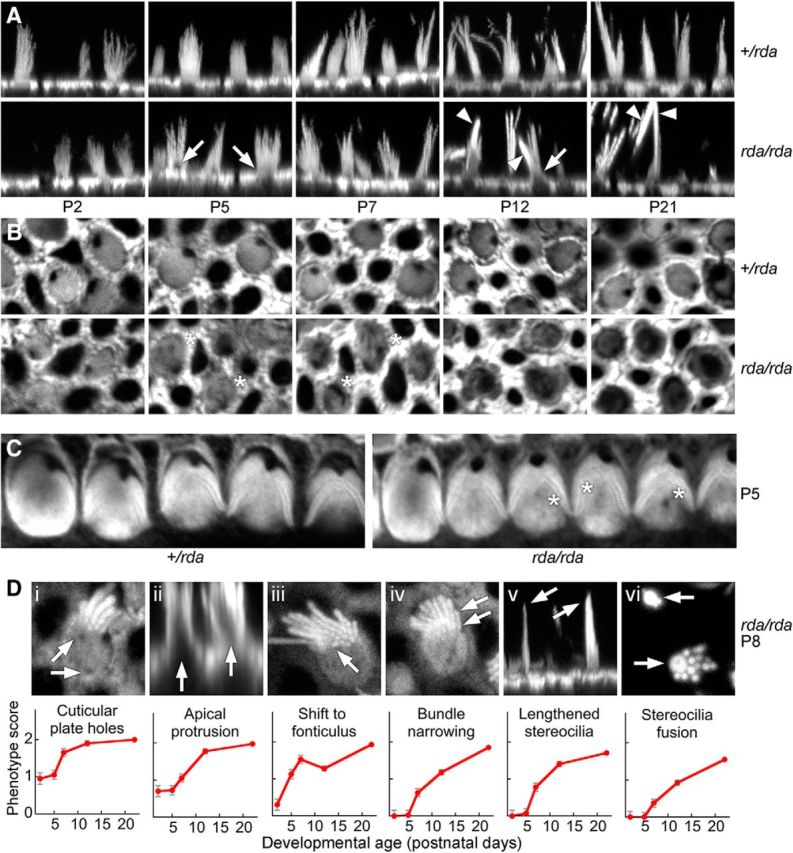
Figure 4.

Progressive actin structural defects in rda/rda vestibular hair cells. All images use phalloidin to stain actin. A, Confocal images of phalloidin-labeled vestibular hair bundles from +/rda (top) or rda/rda (bottom) mice at various postnatal ages. Arrows mark protrusions of the cell from the apical surface (beginning at P5) and arrowheads indicate fused stereocilia (beginning at P12). Panel full widths: 30 μm. B, Cuticular plates of vestibular hair cells degrade between P5 and P21 in rda/rda mice. Confocal images at the level of the cuticular plate of phalloidin-labeled vestibular hair cells from +/rda (top) or rda/rda (bottom) mice at various postnatal ages. Asterisks mark holes within the cuticular plate actin that develop starting at P5, indicating that cuticular plate degradation precedes stereocilia fusion in rda/rda mice. Panel full widths: 15 μm. C, Cuticular plates of cochlear outer hair cells show some degradation at P5 in rda/rda mice. Asterisks are adjacent to holes within the cuticular-plate actin. Panel full widths: 35 μm. D, Progression of the rda/rda phenotype. Top, Examples of each structural change occurring in rda/rda hair cells. Di, Holes in the cuticular plate; Dii, protrusion of the apical surface; Diii, shift of the bundle to the fonticulus; Div, narrowing of cross-sectional area of bundle; Dv, increased proportion of long stereocilia in bundle; and Dvi, fusion of stereocilia. Arrows indicate examples of the structural changes. Di, Diii, Div, and Dvi are x-y cross-sections from z-stacks; Dii and Dv are projections of x-z reslice stacks. Panel full widths: Di, 10 μm; Dii, 25 μm; Diii, 10 μm; Div, 10 μm; Dv, 25 μm; Dvi, 10 μm. Bottom, Quantitation of progression over development for each phenotype. Hair cells were scored 0, 1, or 2 for no phenotypic change, moderate change, or extensive change; mean ± SEM are indicated (n = 20 for P0; n = 40 for all other time points).
