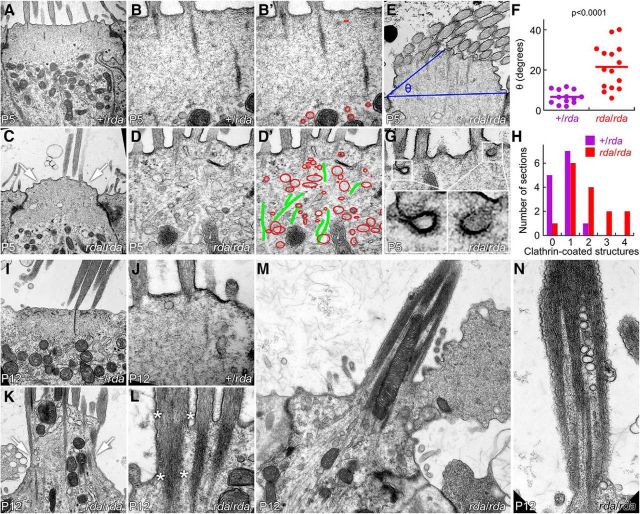
Figure 5.
Accumulation of apical vesicles and progressive stereocilia fusion in rda/rda vestibular hair cells. A–B, +/rda vestibular hair cells at P5. C–D, rda/rda vestibular hair cells at P5. Notice bulging of apical membrane (arrows) and penetration of vesicular structures into the cuticular plate region (outlined in red). B′, D′, Vesicular structures (red) and microtubules (green) overlaid on B and D images. E, Definition of angle θ. A line was drawn connecting the apical end of the tight junctions on either side of the cell, and a second line was drawn from one tight junction to the apical surface halfway across the cell. θ is the angle defined by those two lines. F, Increase in θ measured from rda/rda hair cells. G, Examples of clathrin-coated pits and vesicles in rda/rda hair cells. H, Quantitation of clathrin-coated pits and vesicles. The x-axis indicates the number of clathrin structures seen in a single section, whereas the y-axis indicates the number of sections with that number of clathrin structures. I, J, +/rda vestibular hair cells at P12. I, J, P12 +/rda hair cells. K–N, P12 rda/rda vestibular hair cells. Notice massive extrusion of the cell's apical domain (K, arrows; see also extrusion of apical membrane in M) and fusion of stereocilia actin cores (L, asterisks; see also N). Panel full widths: A, C, I, K, 4 μm; B, D, J, L, 1.2 μm; E, 2.5 μm; G, 1.2 μm; M, 5 μm; N, 1.5 μm.

