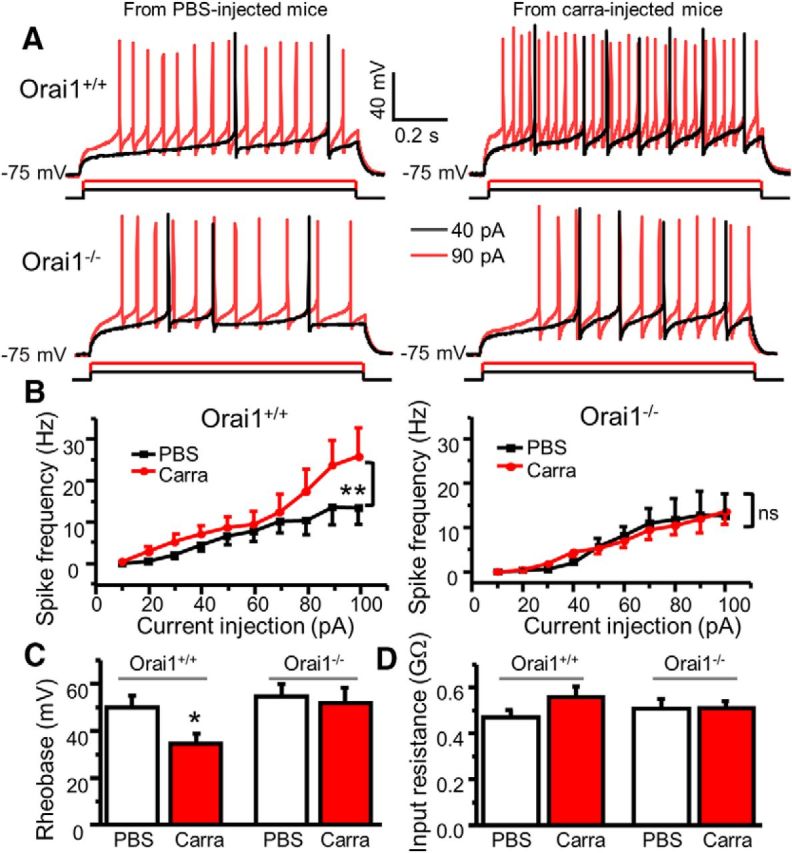
Figure 11.

Orai1 is responsible for carrageenan-induced increase in neuronal excitability. A, Representative action potentials generated by 40 and 90 pA current injections recorded in SG neurons from PBS-injected and carrageenan-injected Orai1+/+ and Orai1−/− mice. B, The current–spike frequency curves from PBS-injected and carrageenan-injected Orai1+/+ and Orai1−/− mice. For Orai1+/+ mice, two-way ANOVA revealed significant differences between PBS-injected and carrageenan-injected groups (F(1,234) = 11.4, p = 0.001). For Orai1−/− mice, F(1,389) = 0.046, p = 0.831. C, Summary of changes in rheobase. For Orai1+/+ mice, n = 16–27, df = 41, t = 2.38645, p = 0.0217. For Orai1−/− mice, n = 19–20, df = 37, t = 0.34836, p = 0.729. D, Summary of changes in input resistance. For Orai1+/+ mice, n = 17–33, df = 48, t = 1.34738, p = 0.18418. For Orai1−/− mice, n = 27–33, df = 58, t = −0.05781, p = 0.95407. Carra, Carrageenan. Values are means ± SEM, *p < 0.05, **p < 0.01 compared with the PBS group by two-way ANOVA or the Student's t test.
