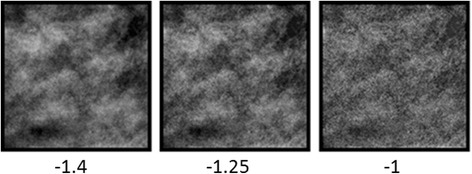
Fig. 3.

Still images illustrating blur after-effects in the images (the animated version of this figure is available to view in Additional file 1). The three adapting images with slopes of − 1.4, − 1.25, or − 1 are shown for 3 s, alternated with three test images all with the same slope of − 1.25 shown for 1 s. The after-effects are best experienced by continuously fixating the center image. The test images on the left and right should appear sharper and blurrier, respectively, relative to the central test image
