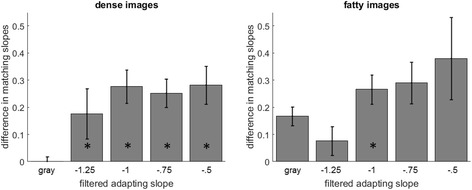
Fig. 4.

Blur after-effects for the mammogram images (original vs sharpened) displayed in the left and right fields. Settings are shown for the dense images (left) or fatty images (right). Each bar shows the physical difference between the slopes of the test images in sharpened vs original adaptor field required to match the perceived slope of the two images and correspond to the mean settings ± 1 standard error. The * symbol indicates adapting slopes where the matching slopes were significantly different from the baseline (no adapt) condition
