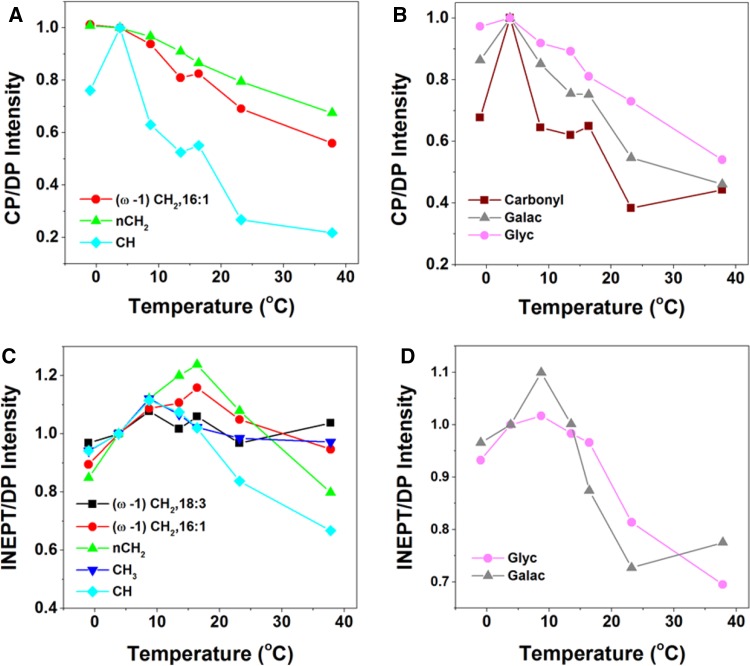
Fig. 4.
13C CP and INEPT intensities of whole-cell components as a function of temperature. The intensities are normalized at T = 3 °C. a CP intensities of fatty acids. Red circles (ω-1)CH2 of 16:1; green triangles nCH2; light-blue squares CH. b CP intensities of protein carbonyls and carbohydrates. Dark-red squares carbonyl; gray triangles galactosyl and glycerol carbons (Galac) of glycerolipids; pink circles glycoprotein and glycerol C1/C3 carbons (Glyc). c INEPT intensities of fatty acids. Black squares (ω-1)CH2 of 18:3; red circles (ω-1)CH2 of 16:1; green triangles nCH2; dark-blue triangles CH3; light-blue squares CH. d INEPT intensities of protein carbonyls and carbohydrates. Gray triangles galactosyl and glycerol carbons of glycerolipids; pink circles glycoprotein and glycerol C1/C3 carbons

