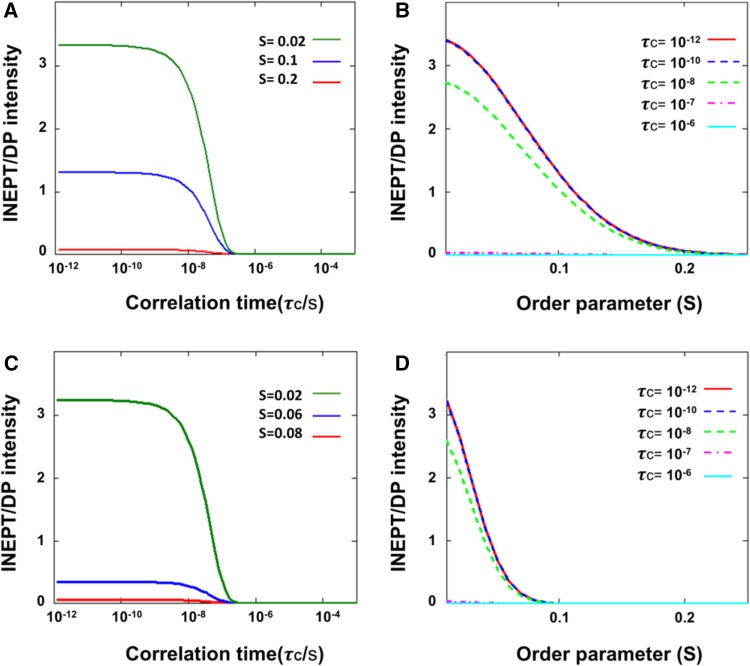
Fig. 6.
Simulated INEPT/DP intensities as a function of order parameter S and rotational correlation time τ c for a CH segment. a INEPT/DP intensities for ω R = 13 kHz (simulating the thylakoid experiments) as function of τ C at S = 0.2, 0.1 and 0.02. b INEPT/DP intensities for ω R = 13 kHz as a function of S at τ C = 10−12, 10−10, 10−8, 10−7 and 10−6 s. c INEPT/DP intensities for ω R = 5 kHz (simulating the whole-cell experiments) as a function of τ C at S = 0.08, 0.06 and 0.02. d INEPT/DP intensities for ω R = 5 kHz as a function of S at τ C = 10−12, 10−10, 10−8, 10−7 and 10−6 s

