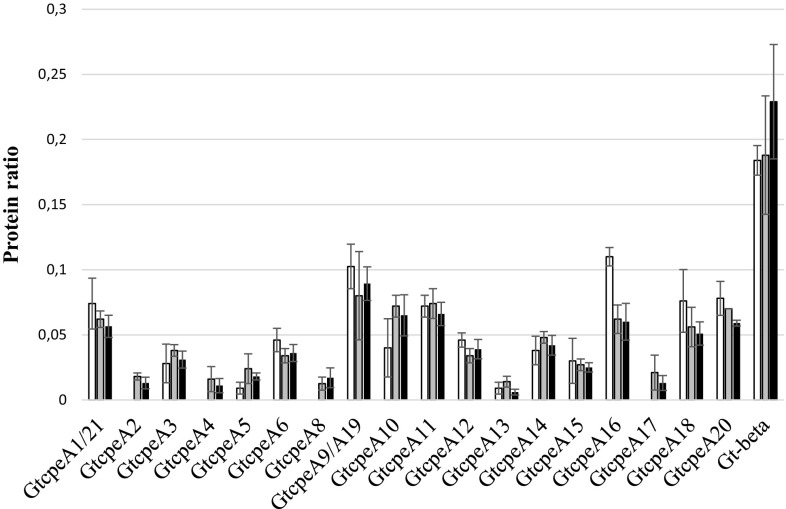
Fig. 5.
Relative expression of the individual phycobiliproteins of G. theta relative to the pool of all phycobiliproteins. G. theta cells were grown either at low light (LL, black bars), standard light (SL, gray bars), or high light (HL, white bars). For each light condition, the ratios of the individual phycobiliproteins to the entire phycobiliprotein pool were determined by semiquantitative peptide counting according to Dowle et al. (2016). GtcpeA1 and GtcpeA21, and GtcpeA9 and GtcpeA19 were quantified as groups and not as individual proteins, because of their high sequence similarity. The data are based on five biological replicates with three technical replicates each. The standard deviations were calculated from the ratios of the phycobiliproteins obtained for each biological replicate and included in the graph as error bars

