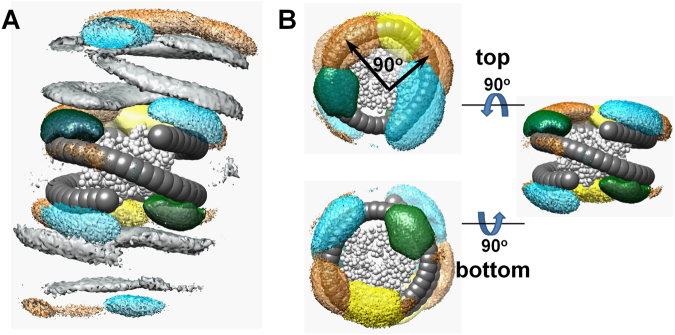
Figure 8.
CG simulations reveal tail screening and tail-tail correlations in the NCP-NCP stacking contact. (A) Spatial distribution functions (SDF) showing the averaged particle densities around the central NCP (DNA, dark grey, HO, light grey) of DNA from the outside NCPs (grey), densities of the H4 and H2A N-termini belonging to the central NCP (H2A, yellow; H4, green) and external NCPs (H2A, yellow-orange; H4, cyan). (B) Detailed views of the internal and external SDFs of the H2A and H4 tails near the top and bottom surfaces of the central NCP. The colour scheme is the same as in (A) The top cartoon in (B) shows that there are two areas populated by the external H2A tail (indicated by black arrows). In (A) and (B), the beads of phosphates, H3, H2B tails, external HO and of CoHex3+ ions are not shown.

