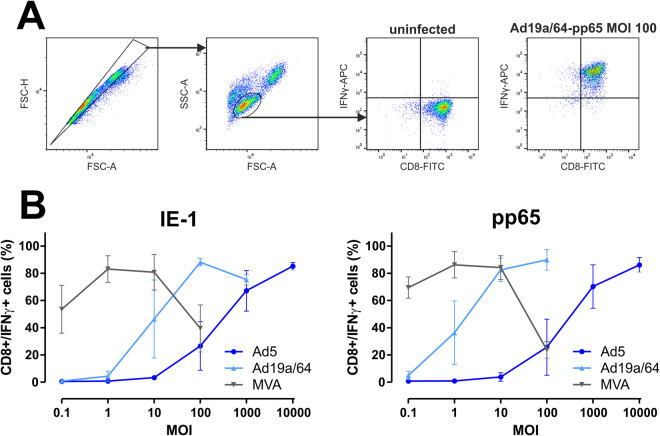
Figure 4.
T cell stimulation by virally transduced DCs correlates with transduction rates. MoDCs from 3 different HCMV seronegative blood donors were infected at varying MOIs with the indicated vectors expressing IE-1 or pp65. 24 hpi, antigen-specific, HLA-matched T cell clones were added at an effector/target ratio of 1:1. After 6 hours of co-cultivation in the presence of Brefeldin A (BFA), cells were stained for CD8 and intracellular IFNγ and subjected to flow cytometry analysis. (A) Panel a shows the gating strategy employed to identify CD8/IFNγ positive cells. (B) The fraction of cells co-expressing CD8 and IFNγ is displayed as the mean and standard deviation of values from all donors.

