Figure 7.
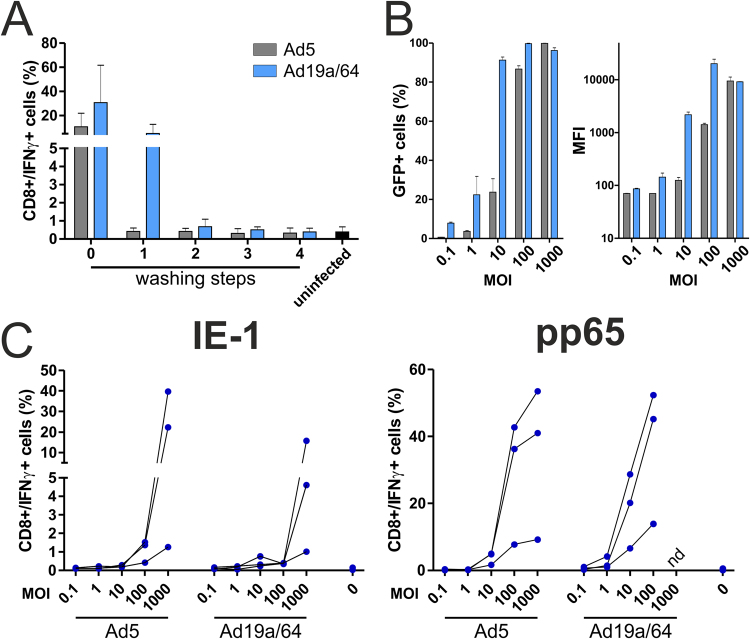
Cross-presentation of IE-1 and pp65 by Ad5 and Ad19a/64-infected cells. (A) HeLa cells were transduced at MOI 1000 with Ad5- or Ad19a/64-pp65. 24 hpi, the supernatant from overnight culture (0) as well as from 4 subsequent washing steps with cell culture medium (1–4) was collected and added to moDCs. After 24 hours, a pp65-specific, HLA-matched T cell clone was added to moDCs at an effector/target ratio of 1:1. Co-culture lasted for another 6 hours in the presence of BFA, followed by CD8/IFNγ staining and flow cytometry analysis (the same gating strategy as in Fig. 4 was employed to identify IFNγ positive T cells). Bars represent the mean and SD from 3 experiments with different blood donors. (B) HeLa cells were transduced at the indicated MOIs with Ad5-GFP or Ad19a/64-GFP and GFP expression was quantified 24 hpi via flow cytometry. (C) HeLa cells were transduced at the indicated MOIs with IE-1 or pp65 expressing AdV vectors. 24 hpi, cells were washed 4 times and added to moDCs at a 1:1 ratio. After 24 hours of co-cultivation, antigen-specific T cell clones were added for a HeLa/DC/T cell ratio of 1:1:1. T cell restimulation was measured after 6 hours as described in A. Connected lines indicate values that were obtained using moDCs from an individual donor (MFI: median fluorescence intensity; nd: not determined).

