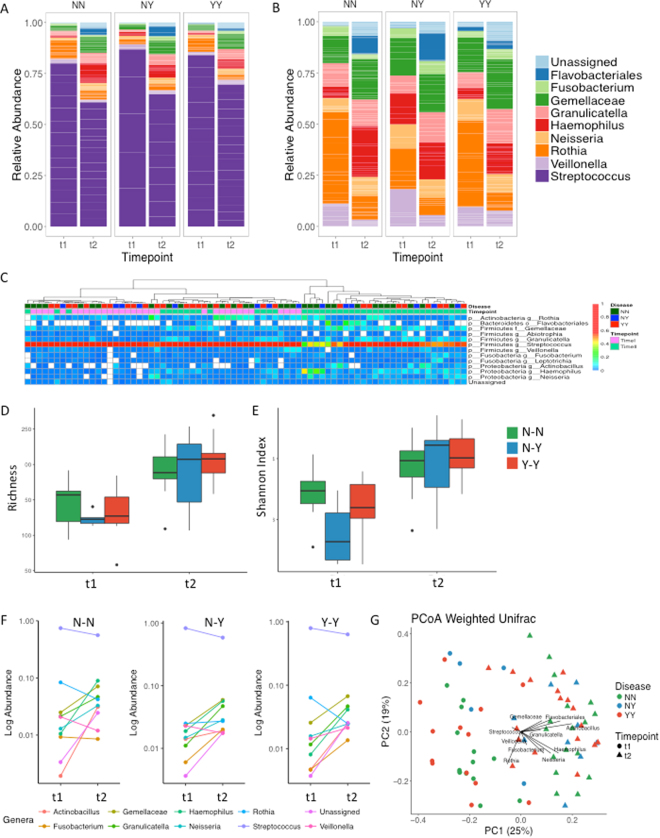
Figure 1.
Longitudinal changes in salivary oral microbiome by caries status. (A and B) Bar graphs indicate the average proportion of each bacterial genus at >1% at baseline (t1) and at the follow-up examination (t2), according to health status: N-N indicates children who remained caries free through the study (n = 14); Y-Y indicates children with caries at both time points (n = 14); N-Y indicates children who were caries-free at baseline and developed caries during the study (n = 5). (A) Total bacterial composition. (B) Detail of non-Streptococcus genera composition. (C) Bacterial composition for individual samples. The heatmap shows colour-coded frequencies for all genera found at >1%. Samples are clustered by their genus-level microbial profile. (D) Richness, number of OTUs in each group (E) Shannon Index of bacterial diversity in each group. (F) Line graphs depicting the change in the mean of each genera of >1% abundance at t1 and t2. The panel label N-N, N-Y, Y-Y indicates group. (G) Samples occupy a position in this Principal Coordinates Analysis (PCoA) according to their bacterial composition as estimated by 16S rRNA gene pyrosequencing. Unweighted Bray-Curtis distances were used (a weighted analysis provided very similar results). Samples are colour-coded according to the health status of children. Circles indicate t1, baseline; triangles indicated t2, follow-up.

