
Figure 2.
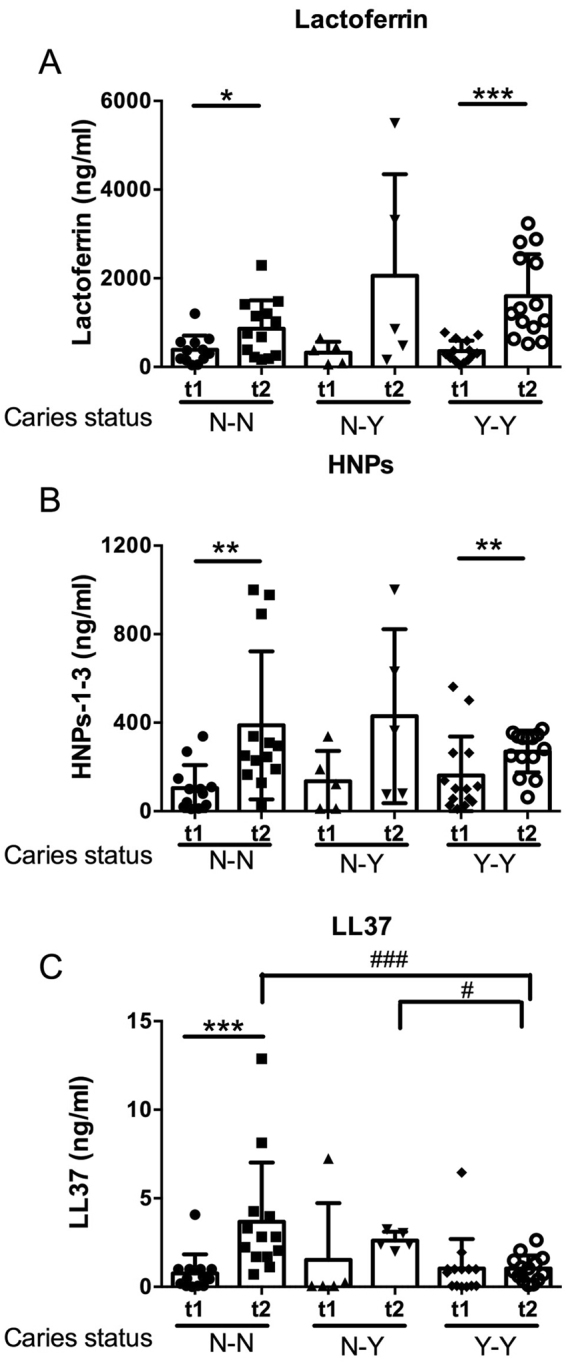
Longitudinal changes in salivary antimicrobials by caries status. Scatterplots comparing the baseline and follow-up concentrations (ng/ml) of (A) lactoferrin, (B) HNPs-1-3 and (C) LL37, grouped according to the change in caries status: N-N (n = 14 children who were caries free at baseline and remained caries free at the follow-up examination), N-Y (n = 5 children who were caries free at baseline but developed caries by the follow-up examination) and Y-Y (n = 14 children who had established caries into dentine at the baseline examination). Each data point represents the mean value for an individual child and the group mean and standard deviation are shown. A statistically significant two-way interaction was achieved for each antimicrobial by time and caries-status (p < 0.05). To test for differences between the concentrations of each antimicrobial at each time point ANOVA with Tukey comparison was used, ###p < 0.001 and #p < 0.05. Students t-test was used to test the differences between the concentration of each antimicrobial within each caries group ***p < 0.001, **p < 0.01 and *p < 0.5. Raw data are shown. Statistical analyses used log10-transformed data.