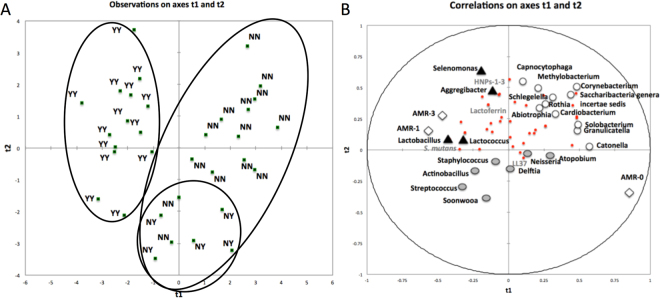
Figure 3.
The interaction between salivary microbiome and salivary antimicrobials on caries progression.PLS-DA modeling plots. The PLS-DA model used caries-status at follow-up as the dependent variable with baseline salivary microbiome data, baseline salivary antimicrobial data, baseline S. mutans qPCR and baseline clinical data as the independent matrix. A model was generated with two significant components R2 = 0.623, Q2 = 0.207. This model clustered the children into those with established caries (Y-Y) and 2 subgroups of caries-free children, with those who developed caries by the time of the follow-up examination (N-Y) largely distinct from those who remained caries-free at follow-up (N-N) (A). PLS loading scatter plot illustrating important variables for clustering. Variables with VIP-values > 1.0 are highlighted: Clinical data at baseline (diamonds), health-associated VIPs in the upper right dimension (open circles), caries-associated VIPs in the upper left (closed triangles). Variables associated with divergence from health and caries are highlighted (grey circles). Small circles represent other variables used in the analysis but not influential for clustering (VIP < 1) (B).

