Figure 3.
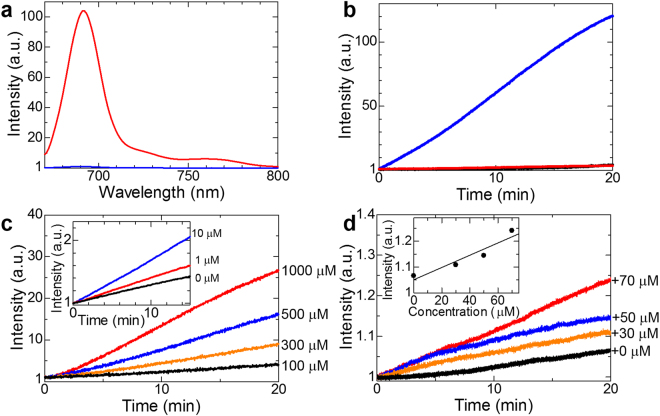
Fluorescence detection of ascorbic acid. (a) Fluorescence spectra of R2c@(BSA)2 in the presence (red) or absence (blue) of 5 mM ascorbic acid at pH 3 (λex = 650 nm). (b) Time courses of fluorescence from R2c@(BSA)2 (blue line), R2c@TX-100 (black line), and liposomal R2c (red line) at pH 7.4, after the addition of ascorbic acid (final conc.: 10 mM). (c) Time courses of R2c@(BSA)2 fluorescence in aqueous solutions at pH 3 after addition of 100 µM (black), 300 µM (orange), 500 µM (blue), and 1000 μM (red) ascorbic acid. Inset, time courses for 0 µM (black), 1 µM (red), and 10 µM (blue) ascorbic acid. The fluorescence change in the absence of ascorbic acid was much smaller than the maximum fluorescence change after the ascorbic acid addition, and thus, R2c@(BSA)2 was sufficiently stable for these experiments. (d) Time courses of R2c@(BSA)2 fluorescence in aqueous solutions at pH 3 after addition of bovine sera supplemented with 0 µM (black), 30 µM (orange), 50 µM (blue), and 70 µM (red) ascorbic acid. Inset, dependence of fluorescence intensity at 20 min on ascorbic acid concentration.

