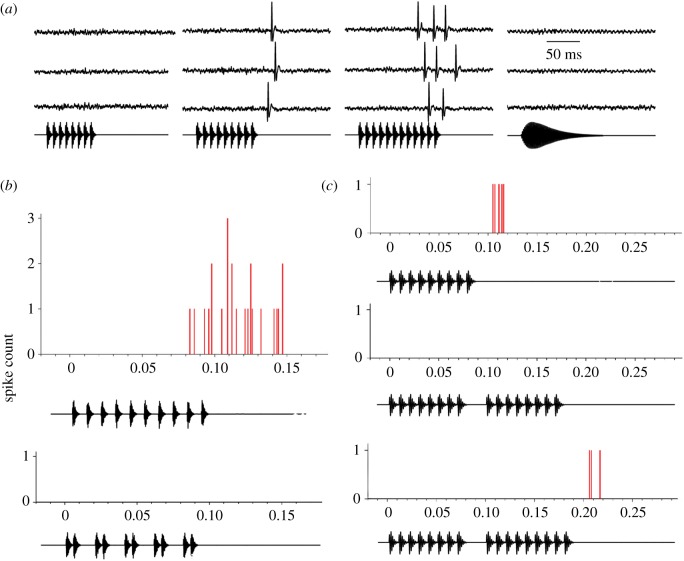
Figure 6.
(a) Oscillograms of extracellularly recorded responses (spikes) of the cell shown in figure 5 to the stimuli shown below each set of traces. Stimulus pulse rate was 100 pulses s−1, and the numbers of pulses (left to right) were 8, 9, 12; the single-pulse stimulus (right) had the same energy as the 12-pulse stimulus, but did not elicit spikes from this neuron. (b) Histograms of spike responses of the same neuron to stimuli that consisted of 10 pulses with 10 ms (optimal) interpulse onset intervals (top) or that alternated between intervals of 5 and 15 ms (lower). (c) Histograms of spike responses to pulse sequences in which the duration of the middle interpulse-onset interval was either 10 ms or 30 ms; after the gap, nine pulses again were required to elicit spikes (lower histogram).

