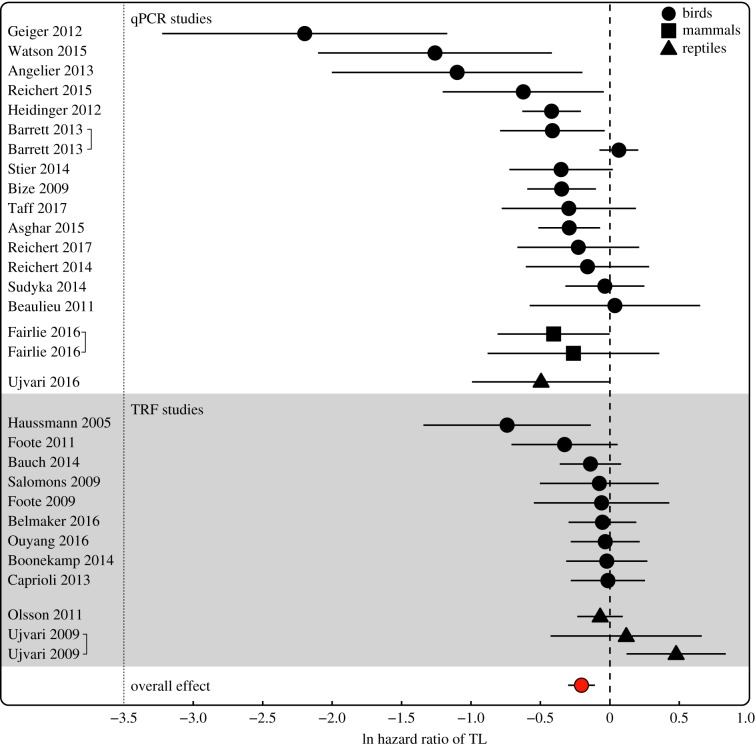
Figure 2.
Forest plot of effect sizes (natural logarithm of the hazard ratio for standardized telomere length) and associated 95% confidence intervals. The overall effect size is shown in red, with estimates grouped by measurement method and with vertebrate class indicated by symbol shape (circle: birds, square: mammals, triangle: reptiles). (Online version in colour.)

