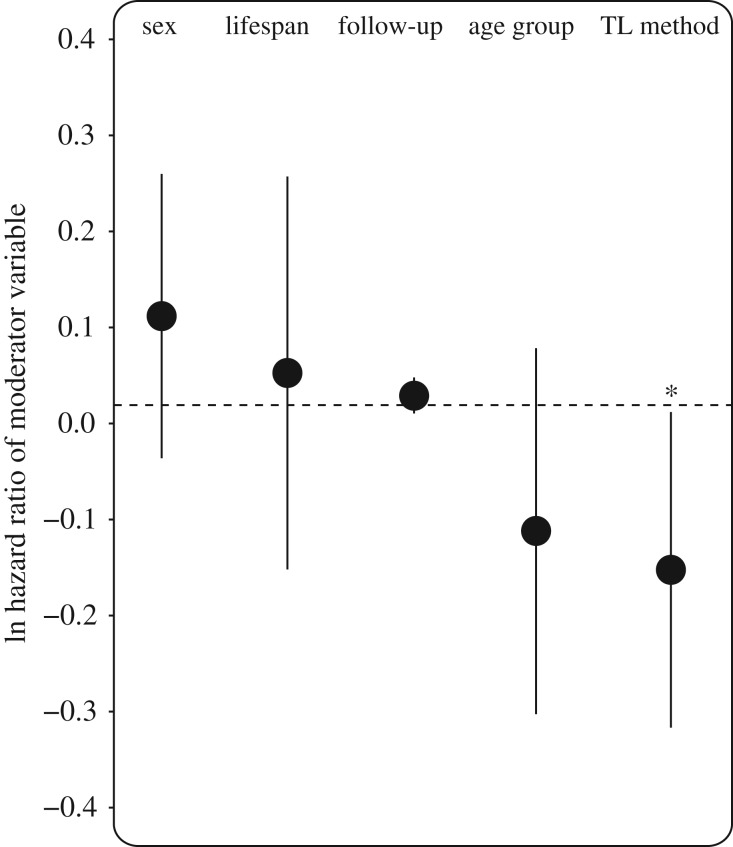
Figure 4.
Natural logarithm of hazard ratio of moderator variables. Grouping differences are expressed as follows: Sex: male–female; TL method: TRF–qPCR; age group: adult–juvenile. Follow-up and the log of lifespan were tested as continuous variable in years. Bars indicate the 95% confidence intervals.

