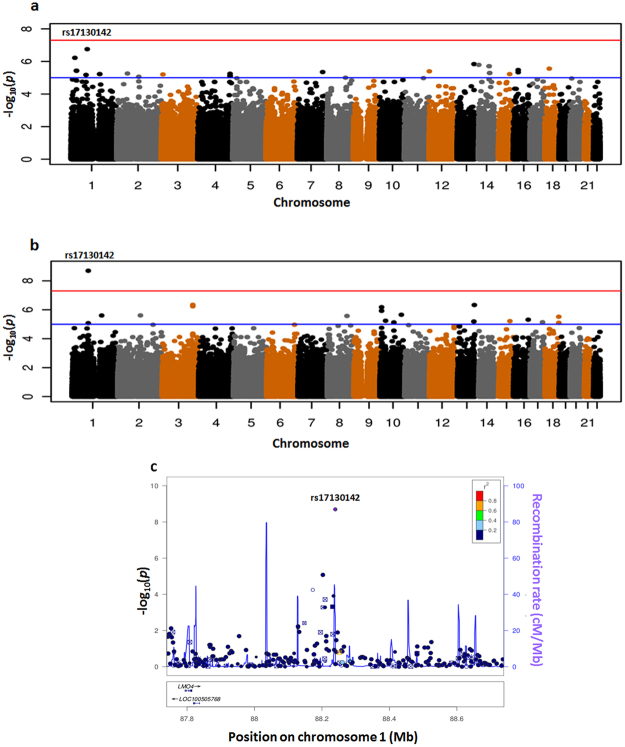
Figure 3.
Paclitaxel GWAS. Manhattan plots of paclitaxel disposition GWAS (a) unadjusted and (b) adjusted for paclitaxel dose, glomerular filtration rate (GFR) and aspartate amino transaminase (AST); (c) LocusZoom plot for rs17130142 from the adjusted paclitaxel GWAS. The color shading indicates the strength of LD (r2) from the reference of 1000 Genome Project (CEU samples) between the corresponding SNP and the top SNP, rs17130142. The red horizontal line indicates the genome-wide significance threshold of P = 5 × 10⁻⁸; the blue line is the threshold for putative association (P = 10−5).

