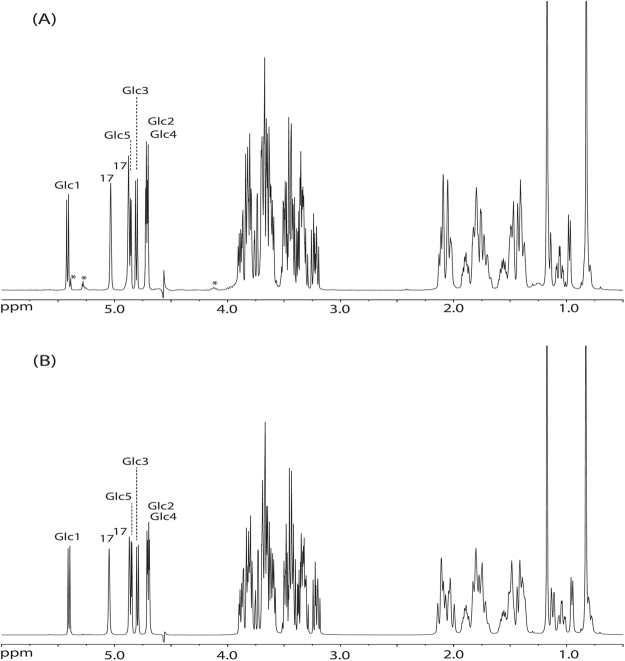
Figure 2.
500-MHz 1H NMR spectra of (A) RebA-G and (B) RebA-G1, recorded in D2O at 310 K. The positions of the anomeric protons of the glucose residues (see Fig. 3) are indicated, as well as the steviol C-17 protons in the anomeric region. Products were synthesized using the mutant Gtf180-ΔN-Q1140E enzyme. Spectrum (B) is identical to that of RebA-G1, prepared with the wild-type Gtf180-ΔN enzyme, and recently published with a complete assignment of resonances23. *Signals stemming from higher α-glucosylated RebA products. Chemical shifts (δ) are expressed in ppm by reference to internal acetone (δ 2.225).

