Figure 3.

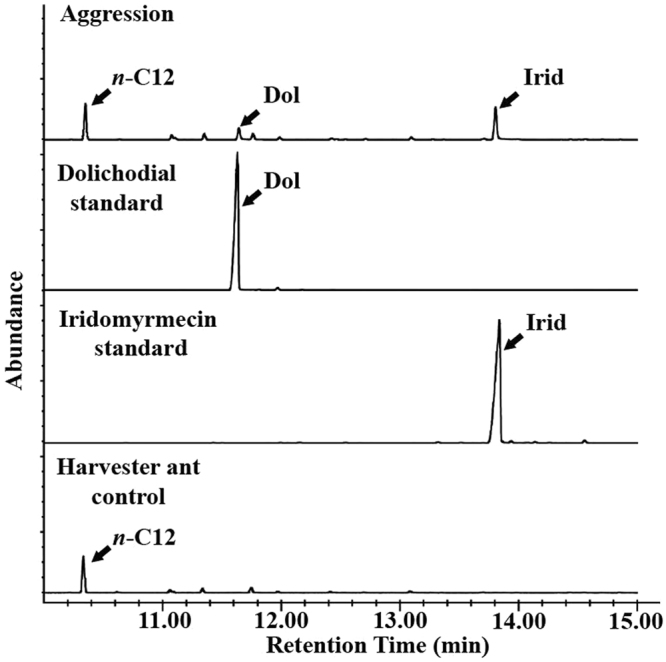
Overlay of representative chromatograms (GC-FID) from the cuticular extract analyses. The samples were collected from a pooled sample of 30 harvester ants after Argentine ant aggression (Aggression), two standards for identification (map of the first two principal componentscin standard), and the cuticular extract of harvester ants without Argentine ant aggression (Harvester ant control). X-axis represents retention time (min) and y-axis represents relative abundance. Peaks for dolichodial (Dol) and iridomyrmecin (Irid) are marked with arrows. n-Dodecane (n-C12) was only present in “Aggression” and “Harvester ant control” samples. Chromatograms represent the polar fractions (methylene chloride).
