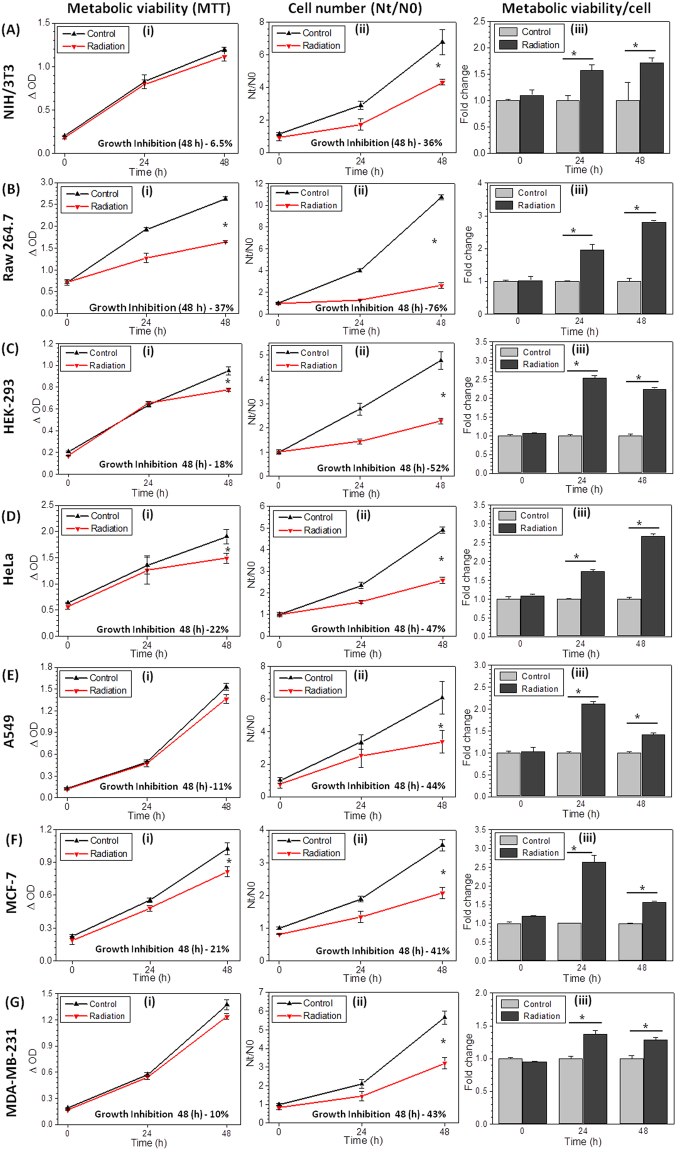
Figure 1.
Underestimation of radiation induced growth inhibition by MTT assay. NIH/3T3 (Ai–Aiii), Raw264.7 (Bi–Biii), HEK-293(Ci–Ciii), HeLa (Di–Diii), A549 (Ei–Eiii), MCF-7(Fi–Fiii) and MDAMB-231(Gi–Giii) were analyzed using MTT assay (Ai–Gi) and cell number estimation (Nt/N0, Aii–Gii) at 5 Gy radiation dose. Further MTT values (ΔOD) were normalized with its respective cell number to quantify the metabolic viability/cell (Aiii to Giii, derived information) and presented as fold change with respect to control at different time intervals. Radiation induced growth inhibition (% value) for both MTT and cell number quantified and mentioned at 48 hours (Graph inset). Star shows the statistical significance of change between the groups. Data are expressed as mean ± SD (n = 4) *p < 0.05 vs. unirradiated cells.

